


Our cutting-edge platform pairs powerful technology with action. We'll help you optimize your sustainability reporting and deliver business value.
The Enterprise Platform forCarbon ManagementData CollectionEnergy ManagementSustainability ReportingScope 3 MeasurementSupplier EngagementFinanced Emissions
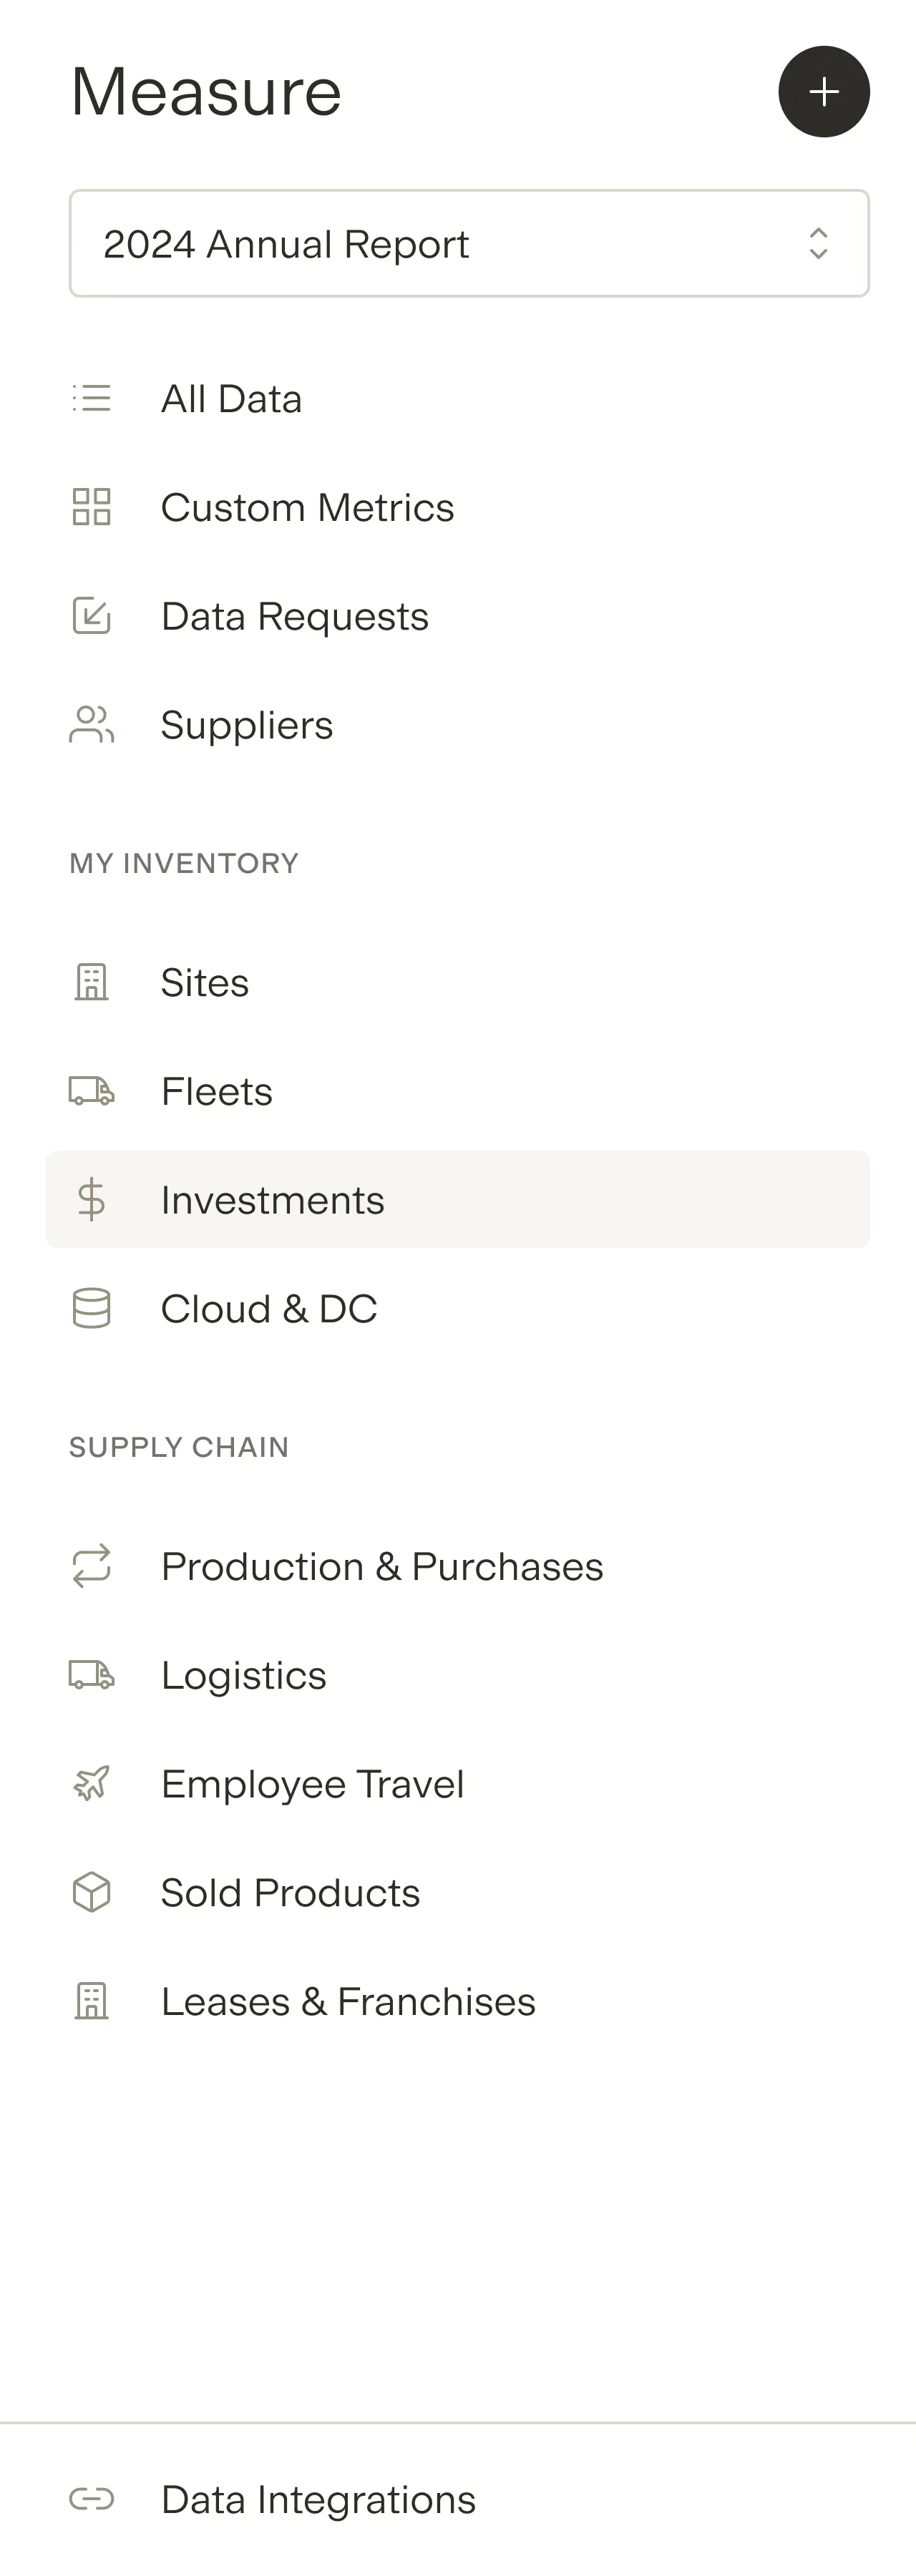
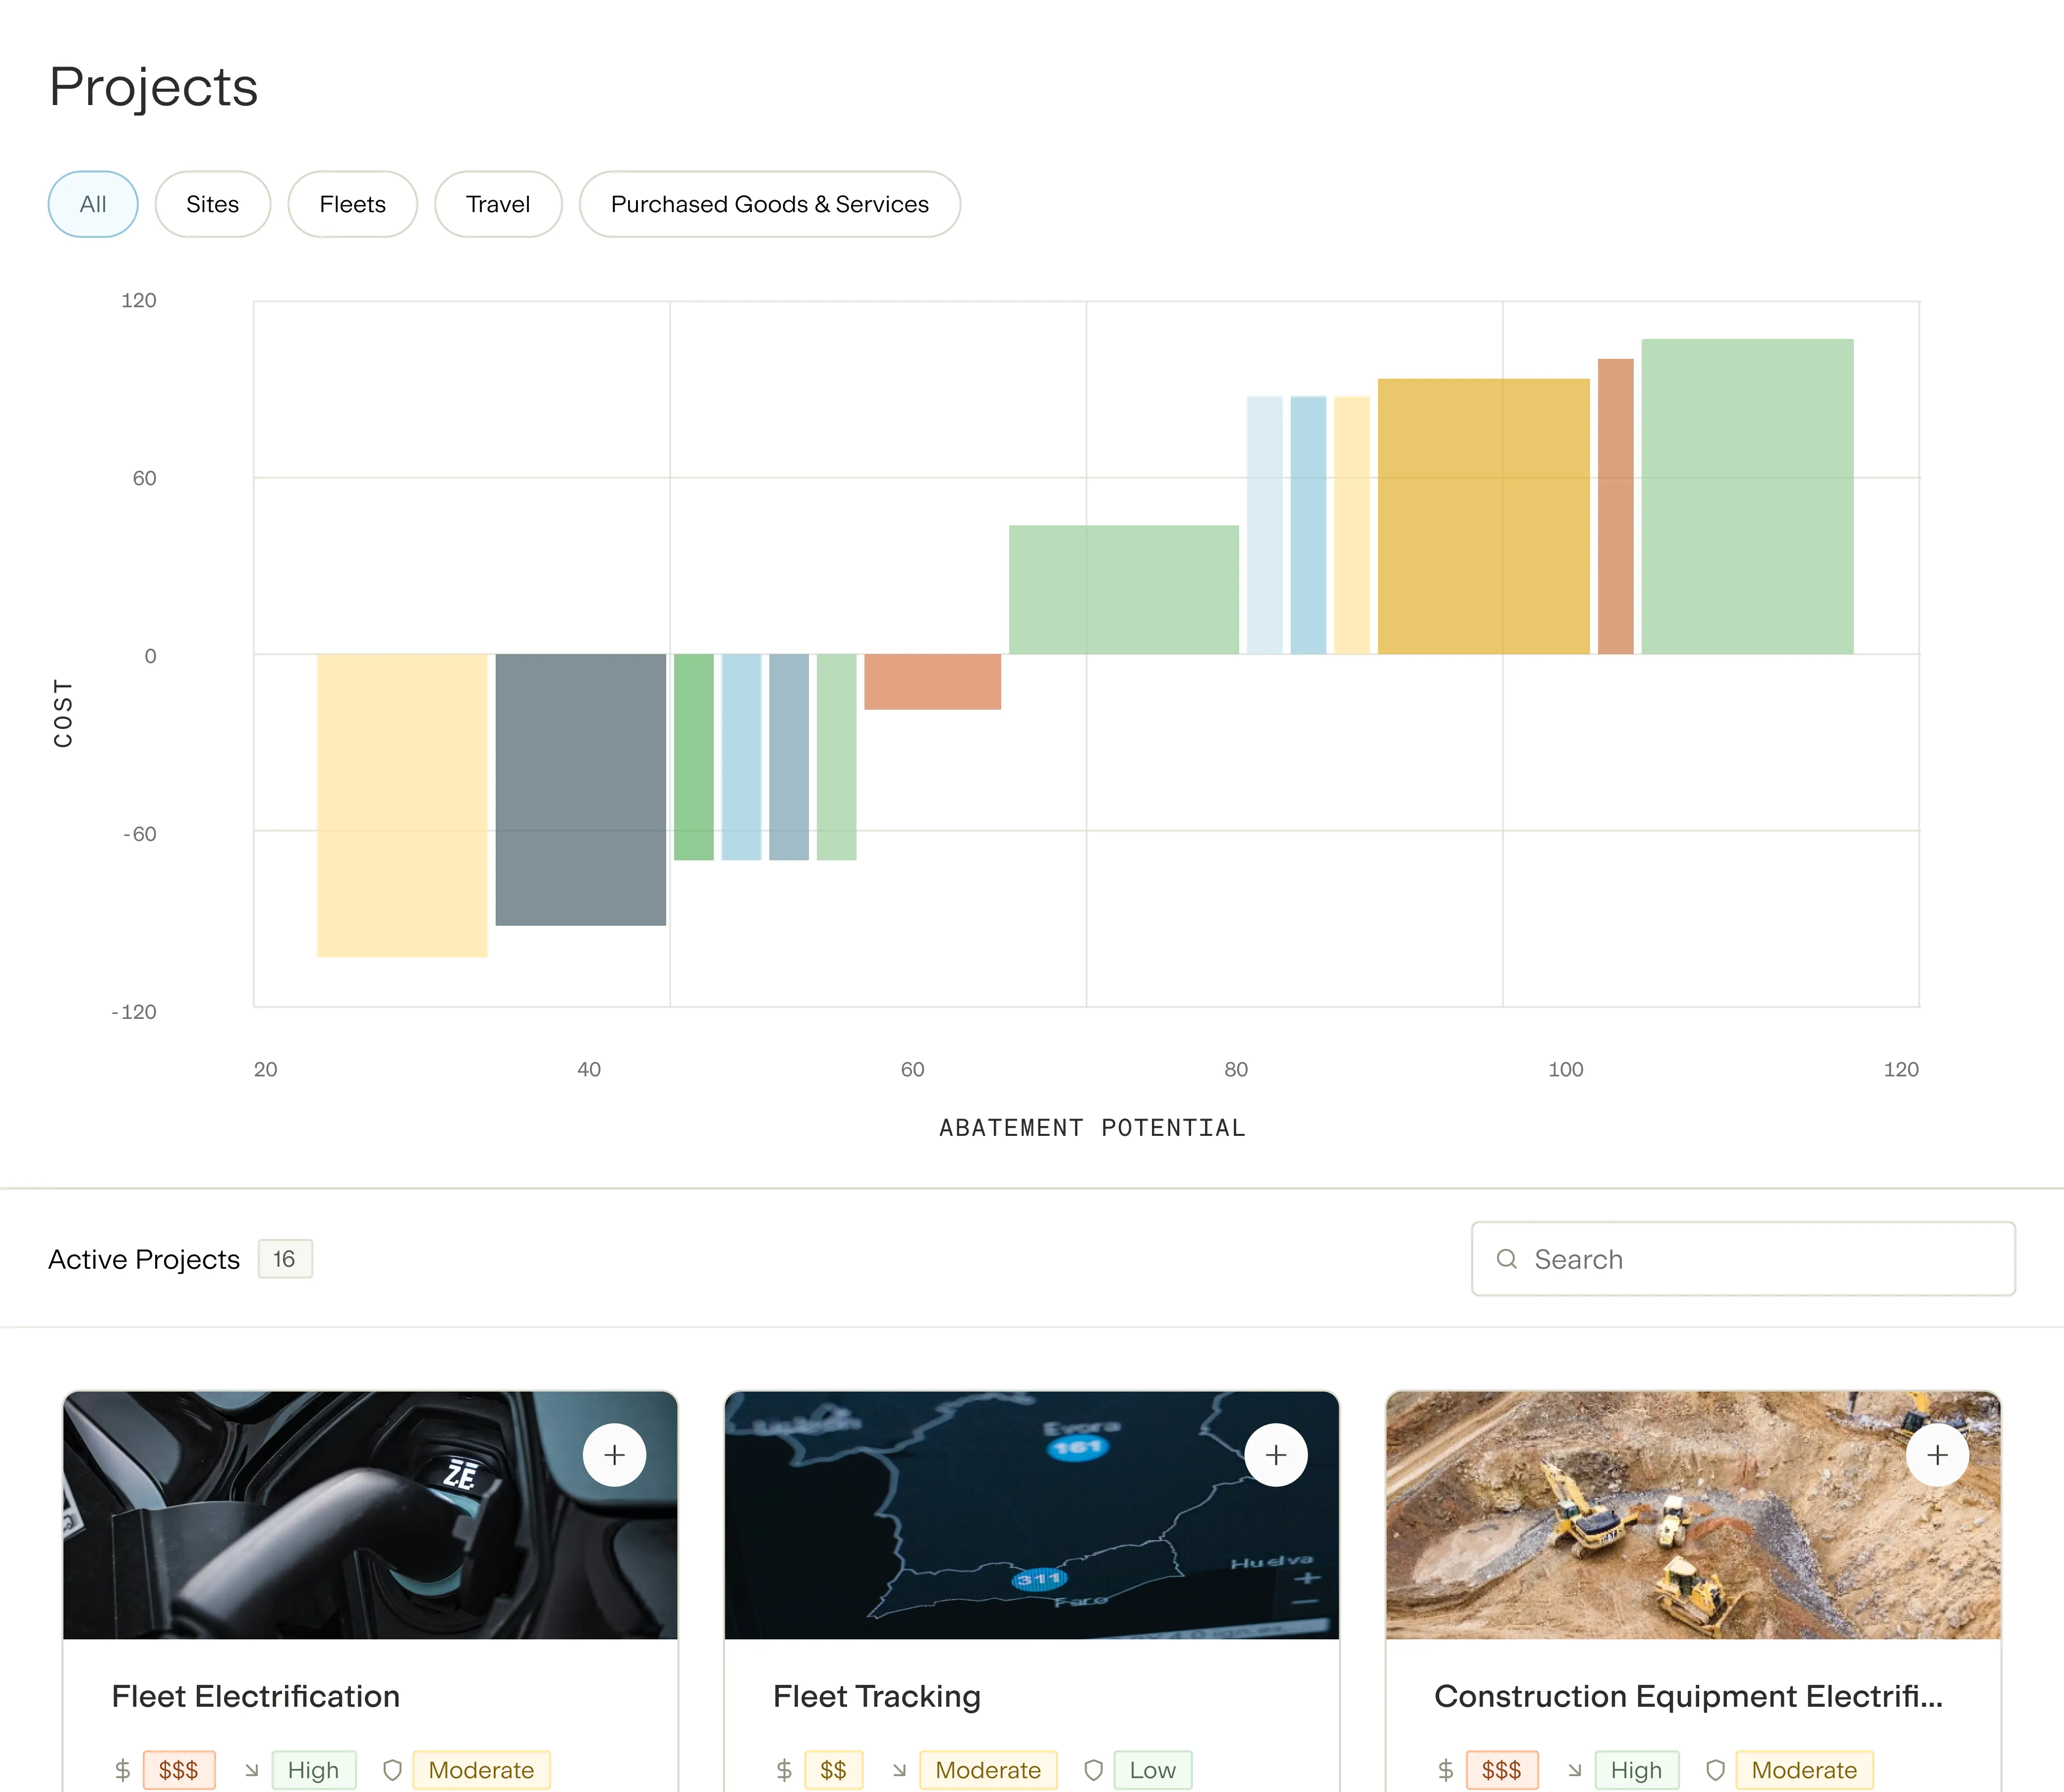
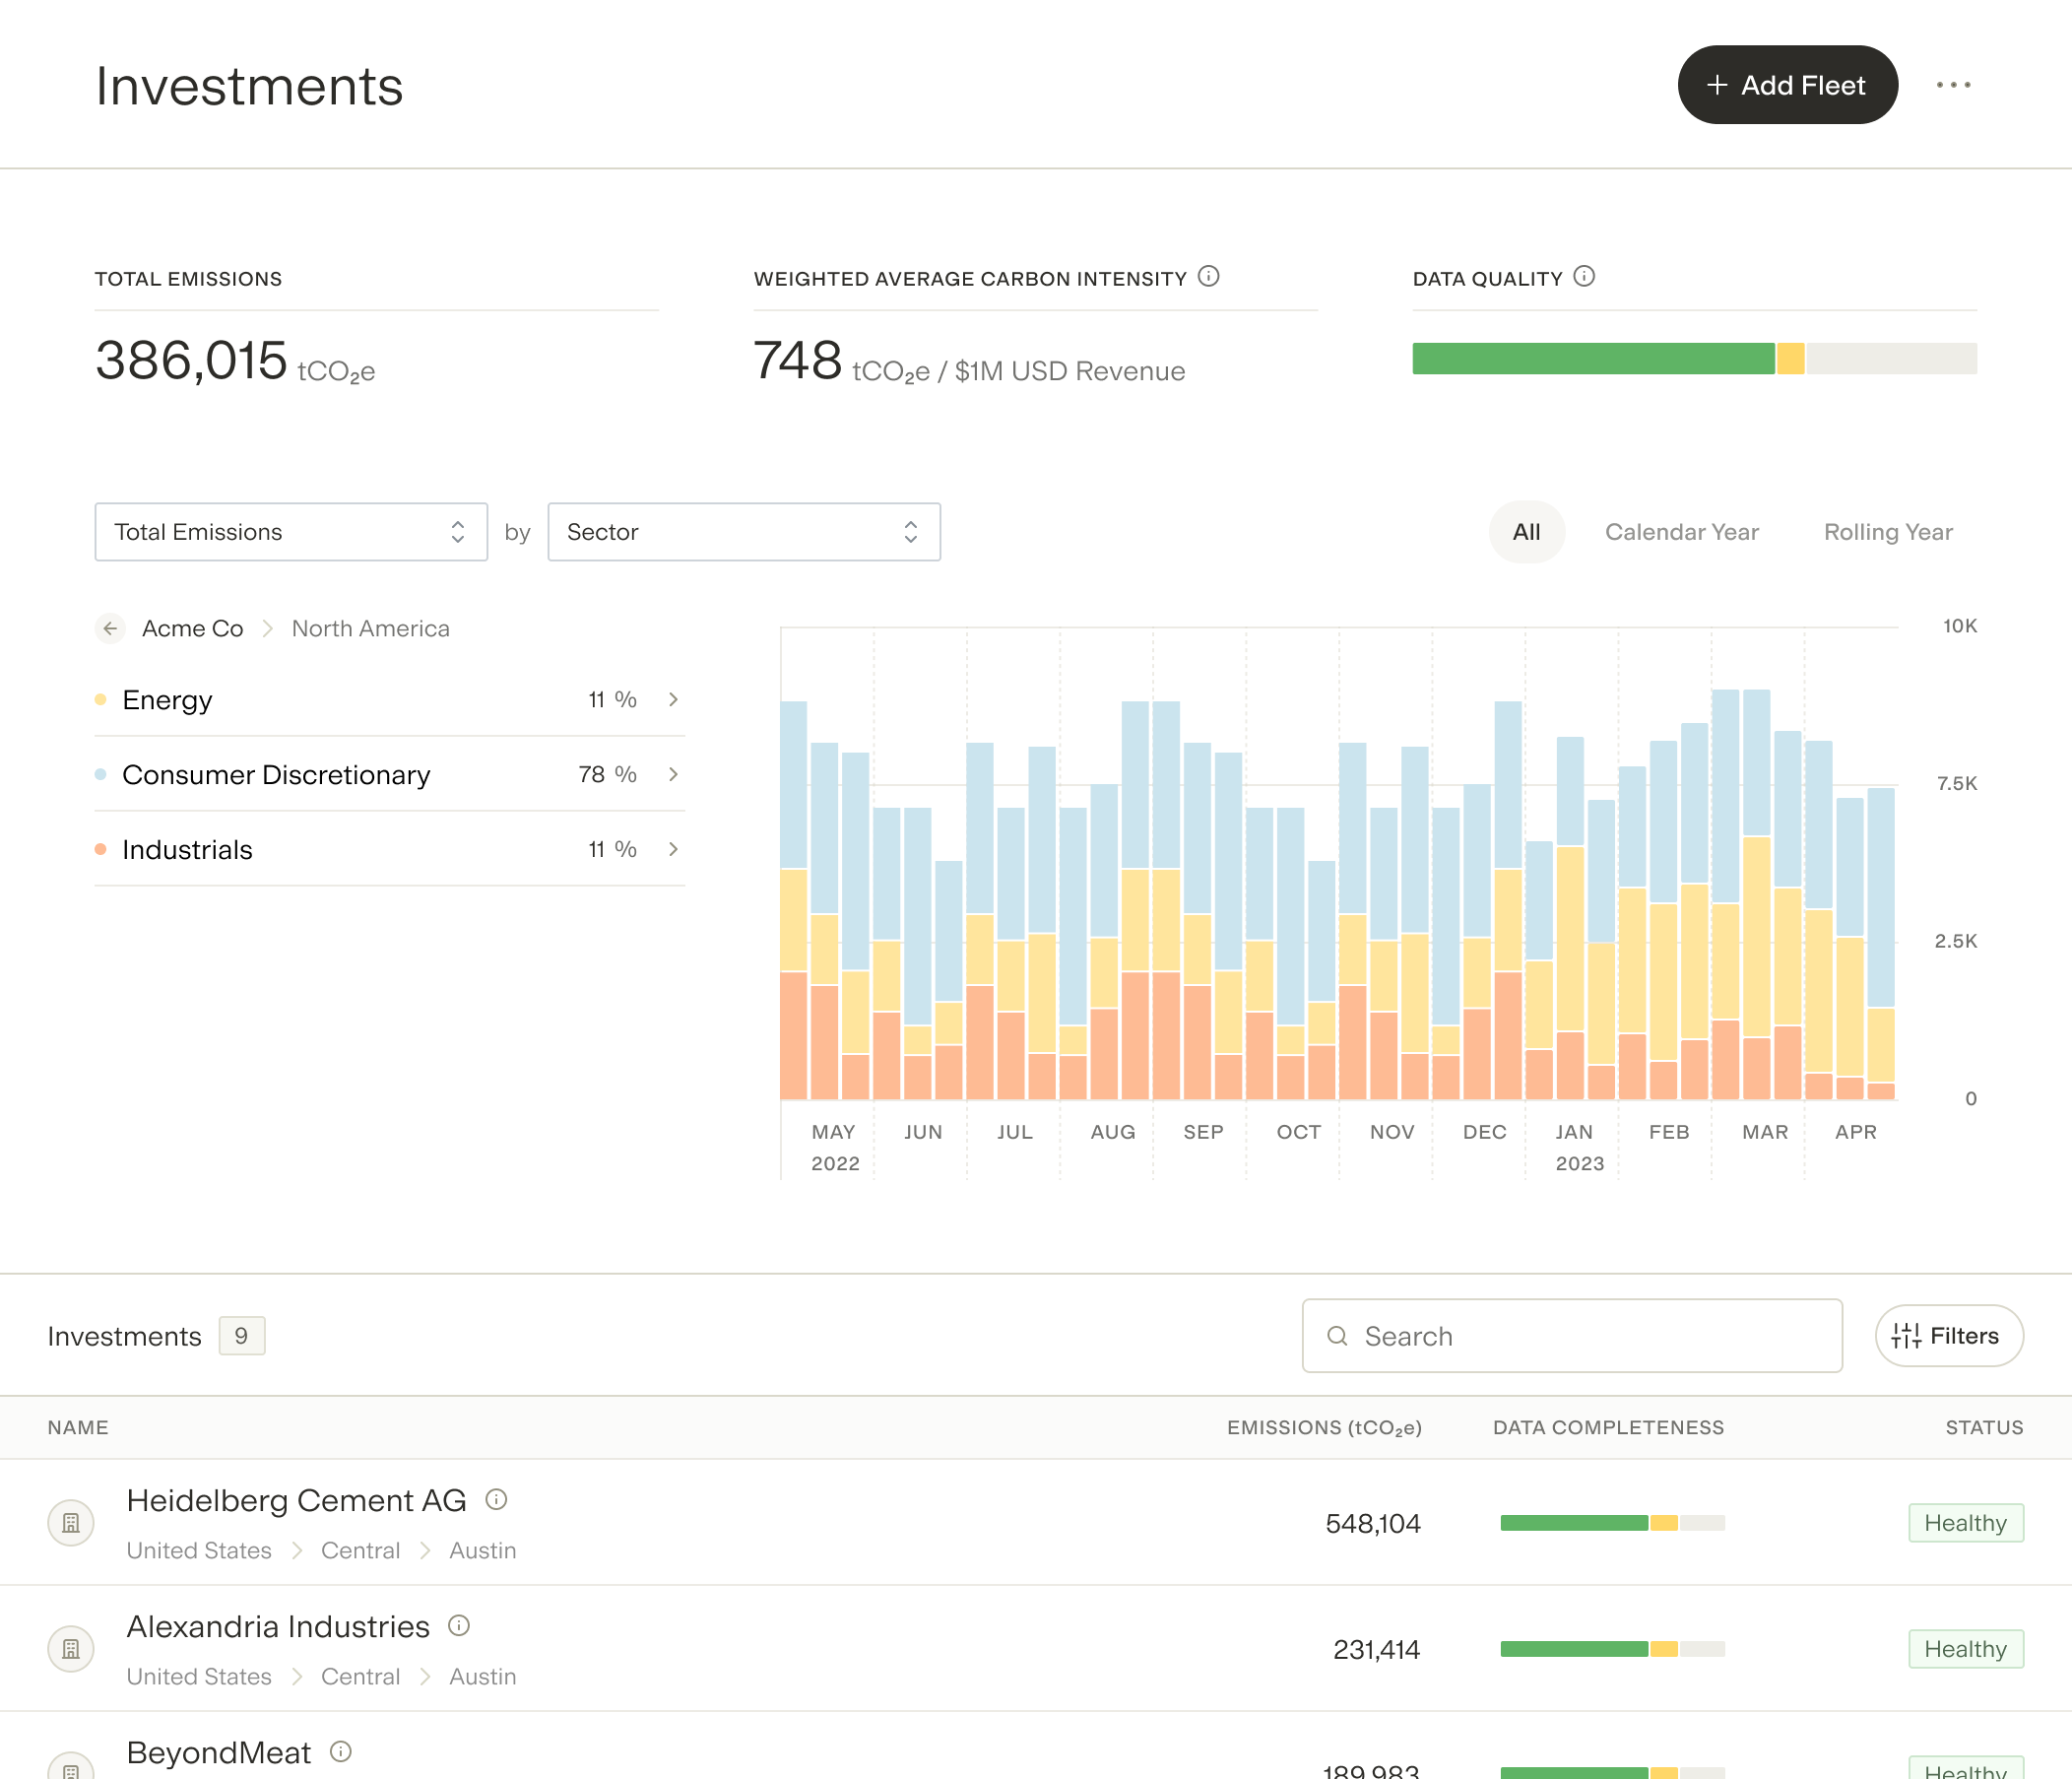
Carbon Management
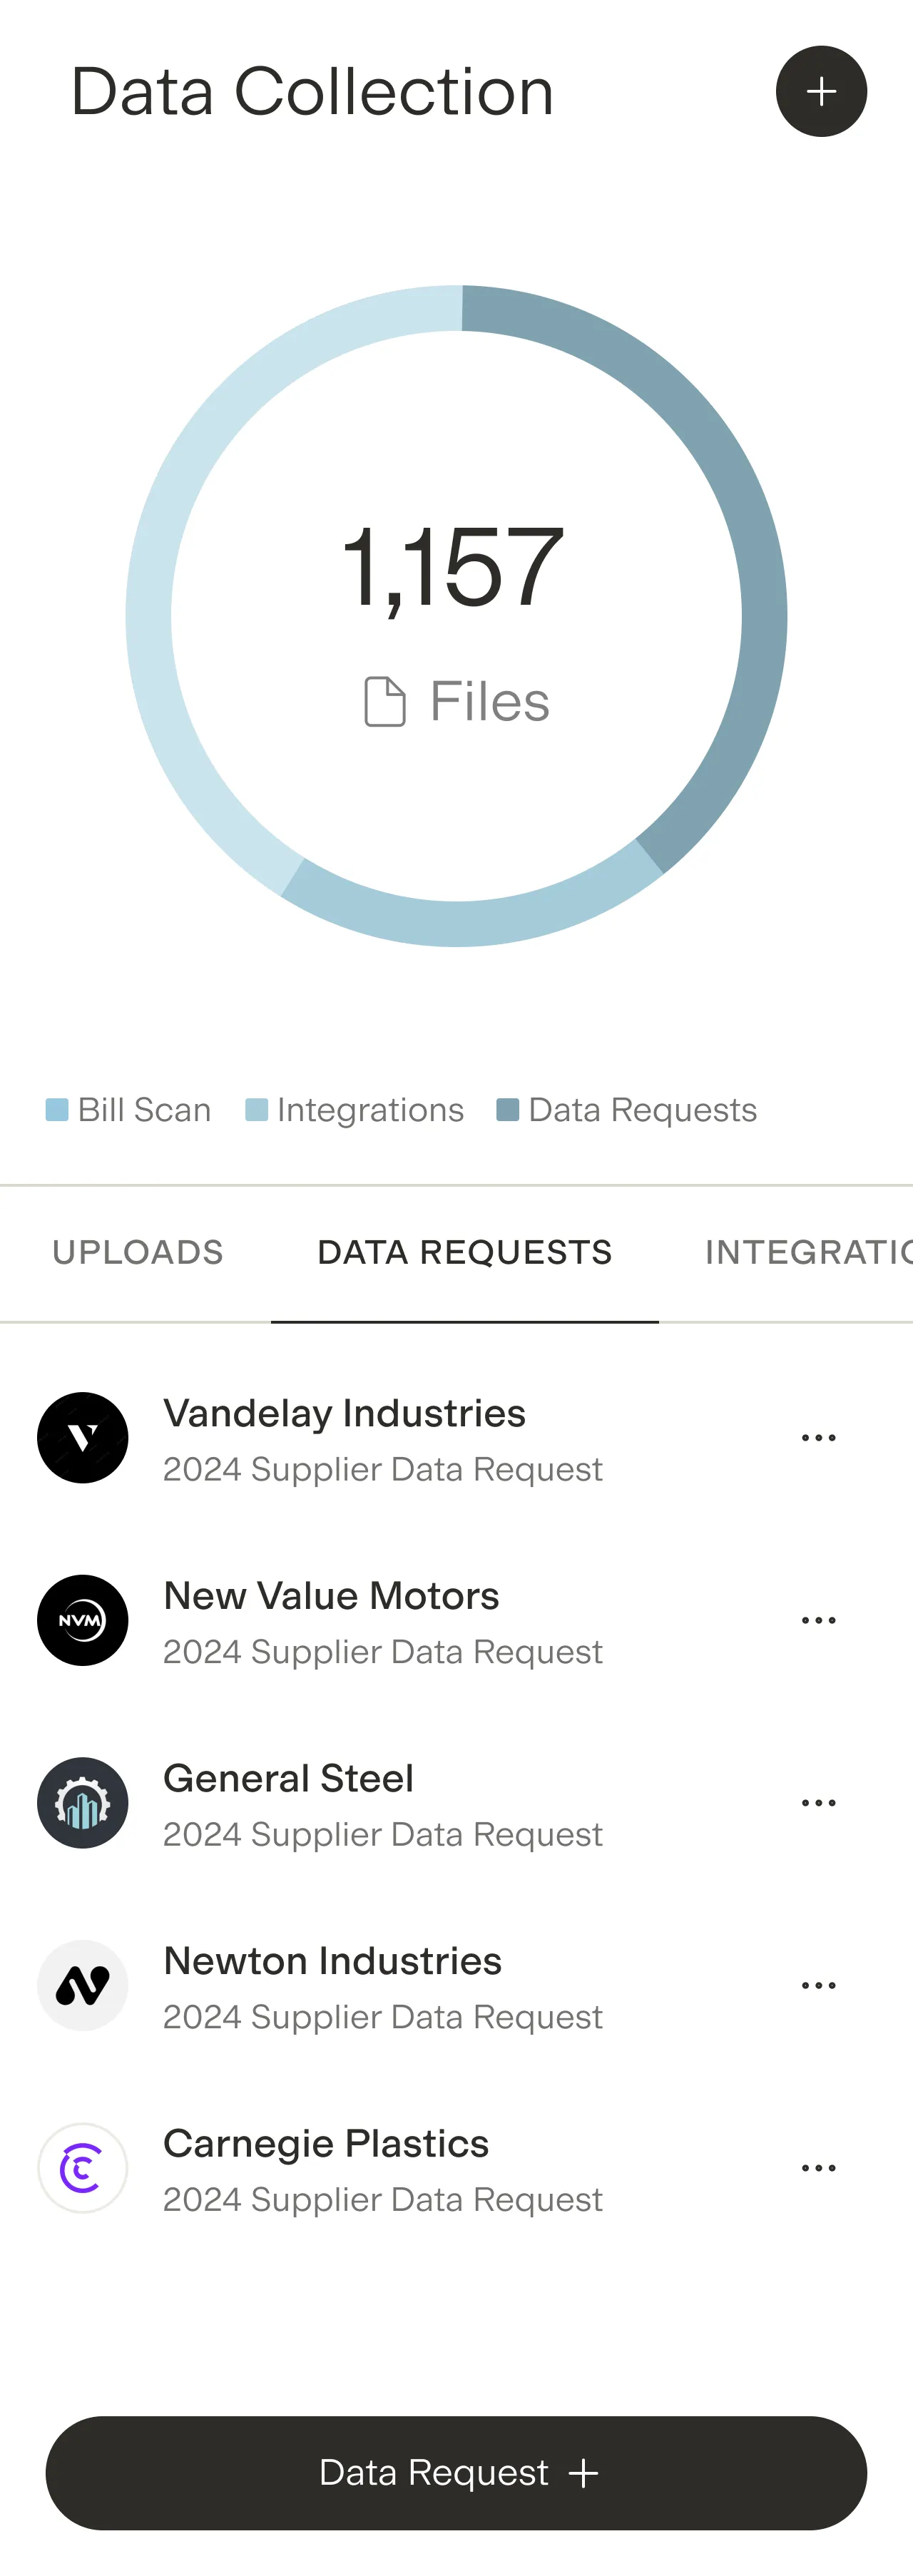
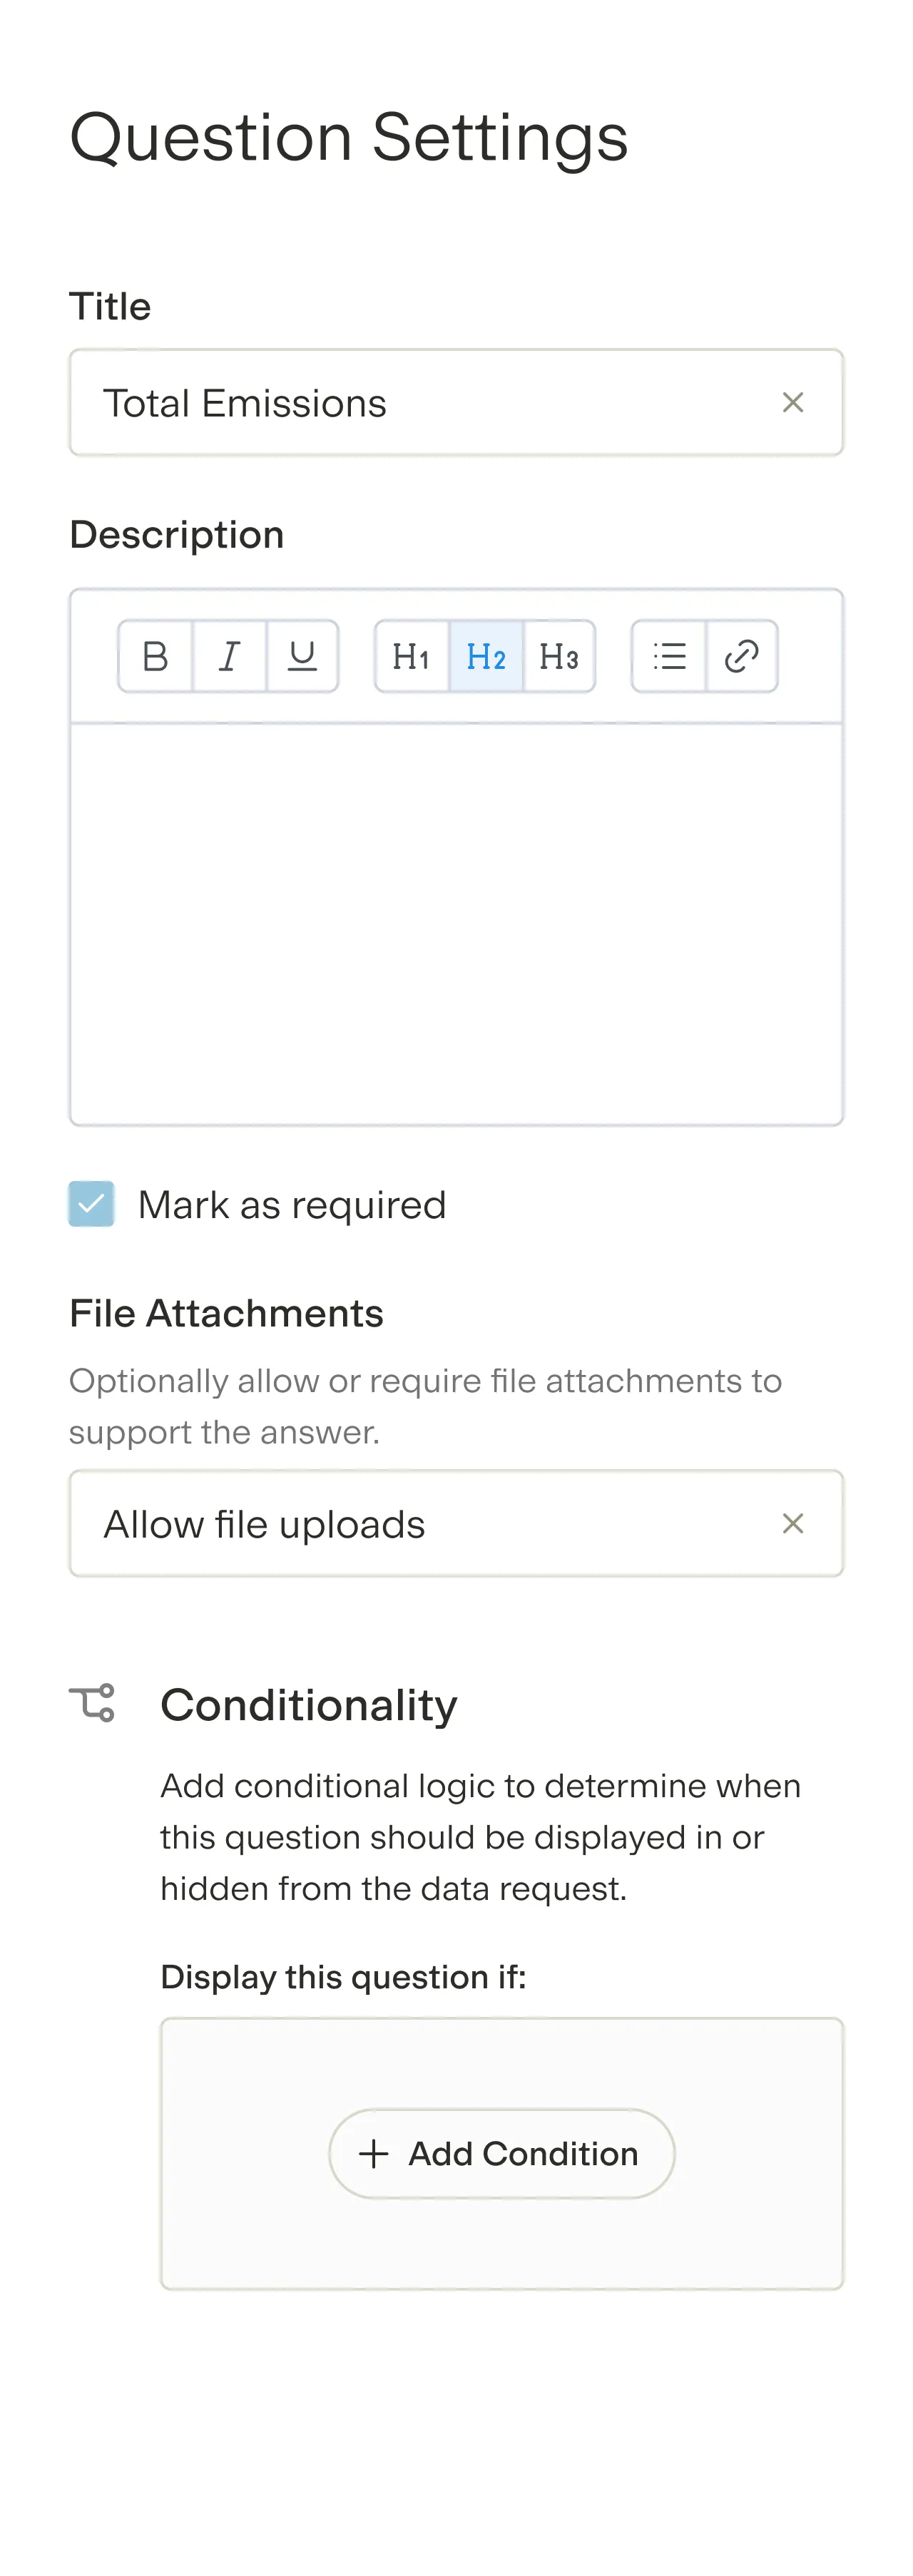
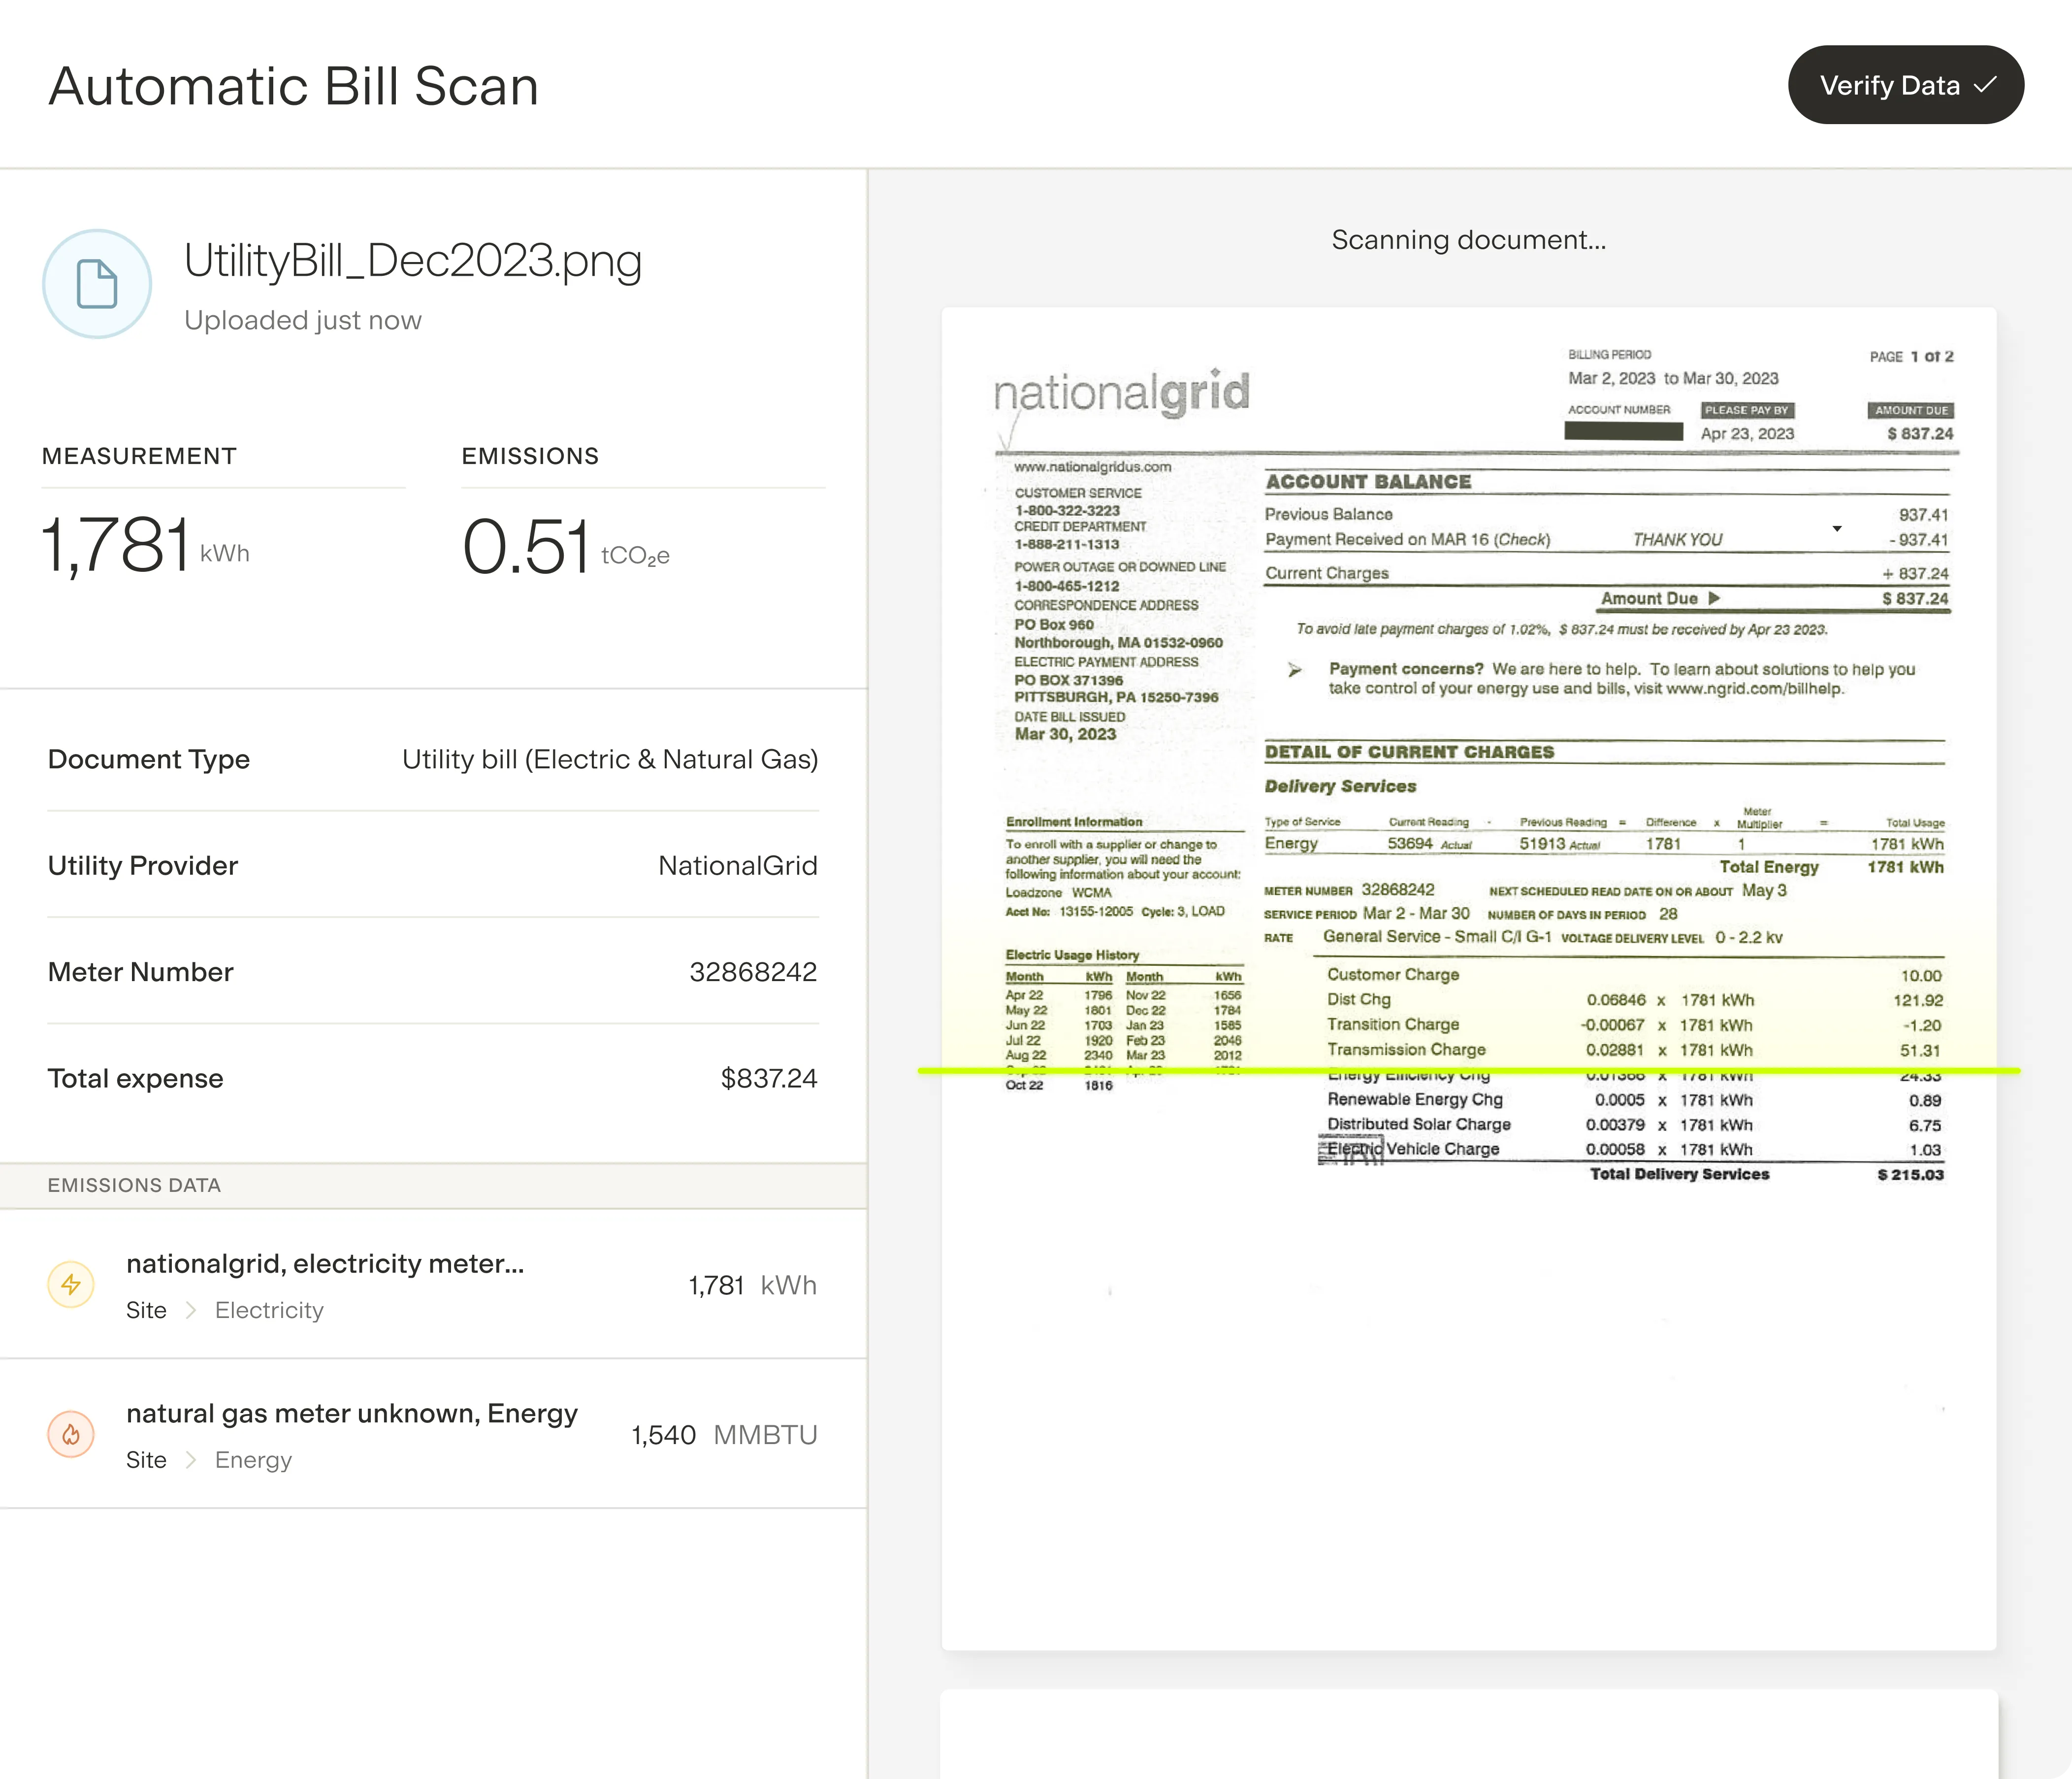
Data Collection
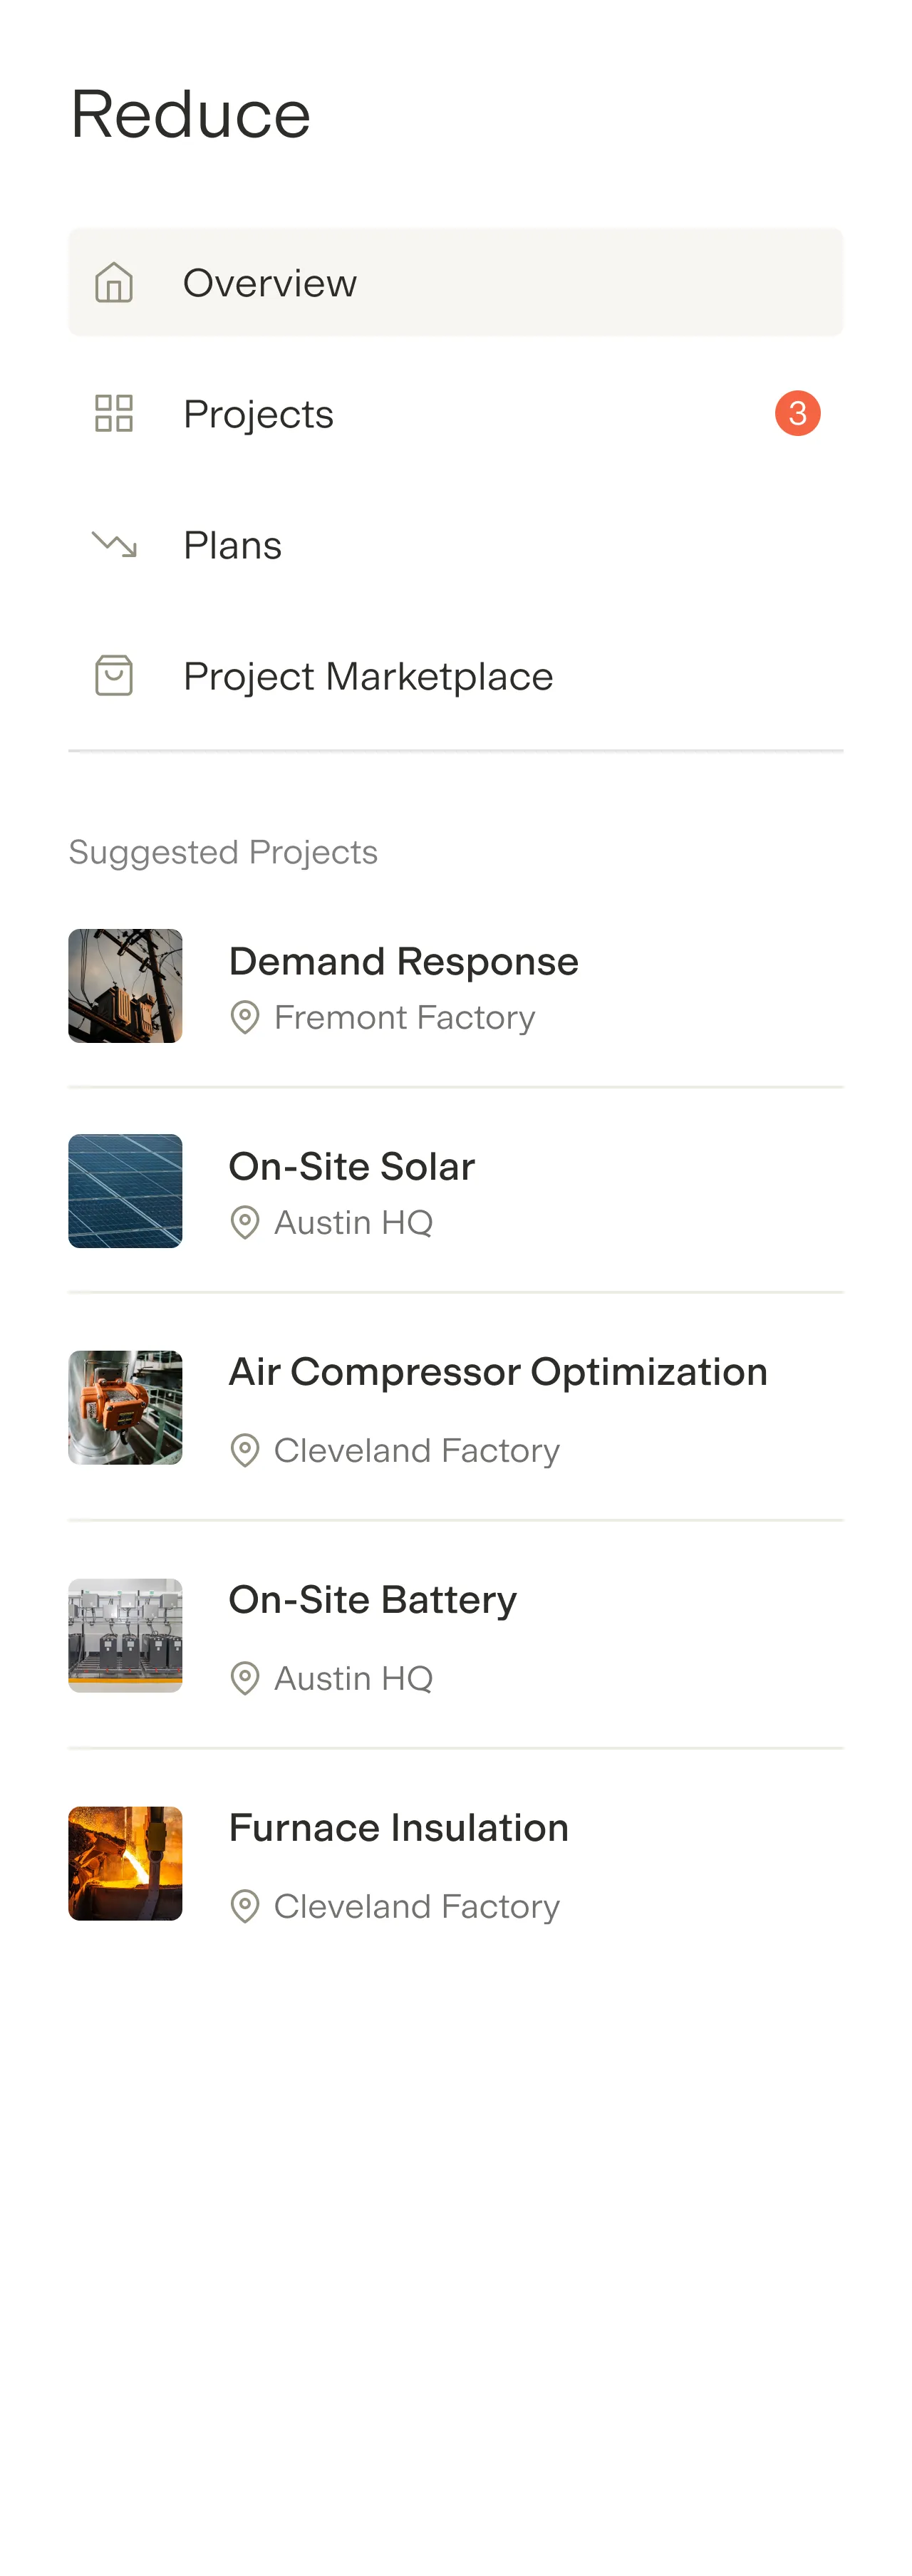
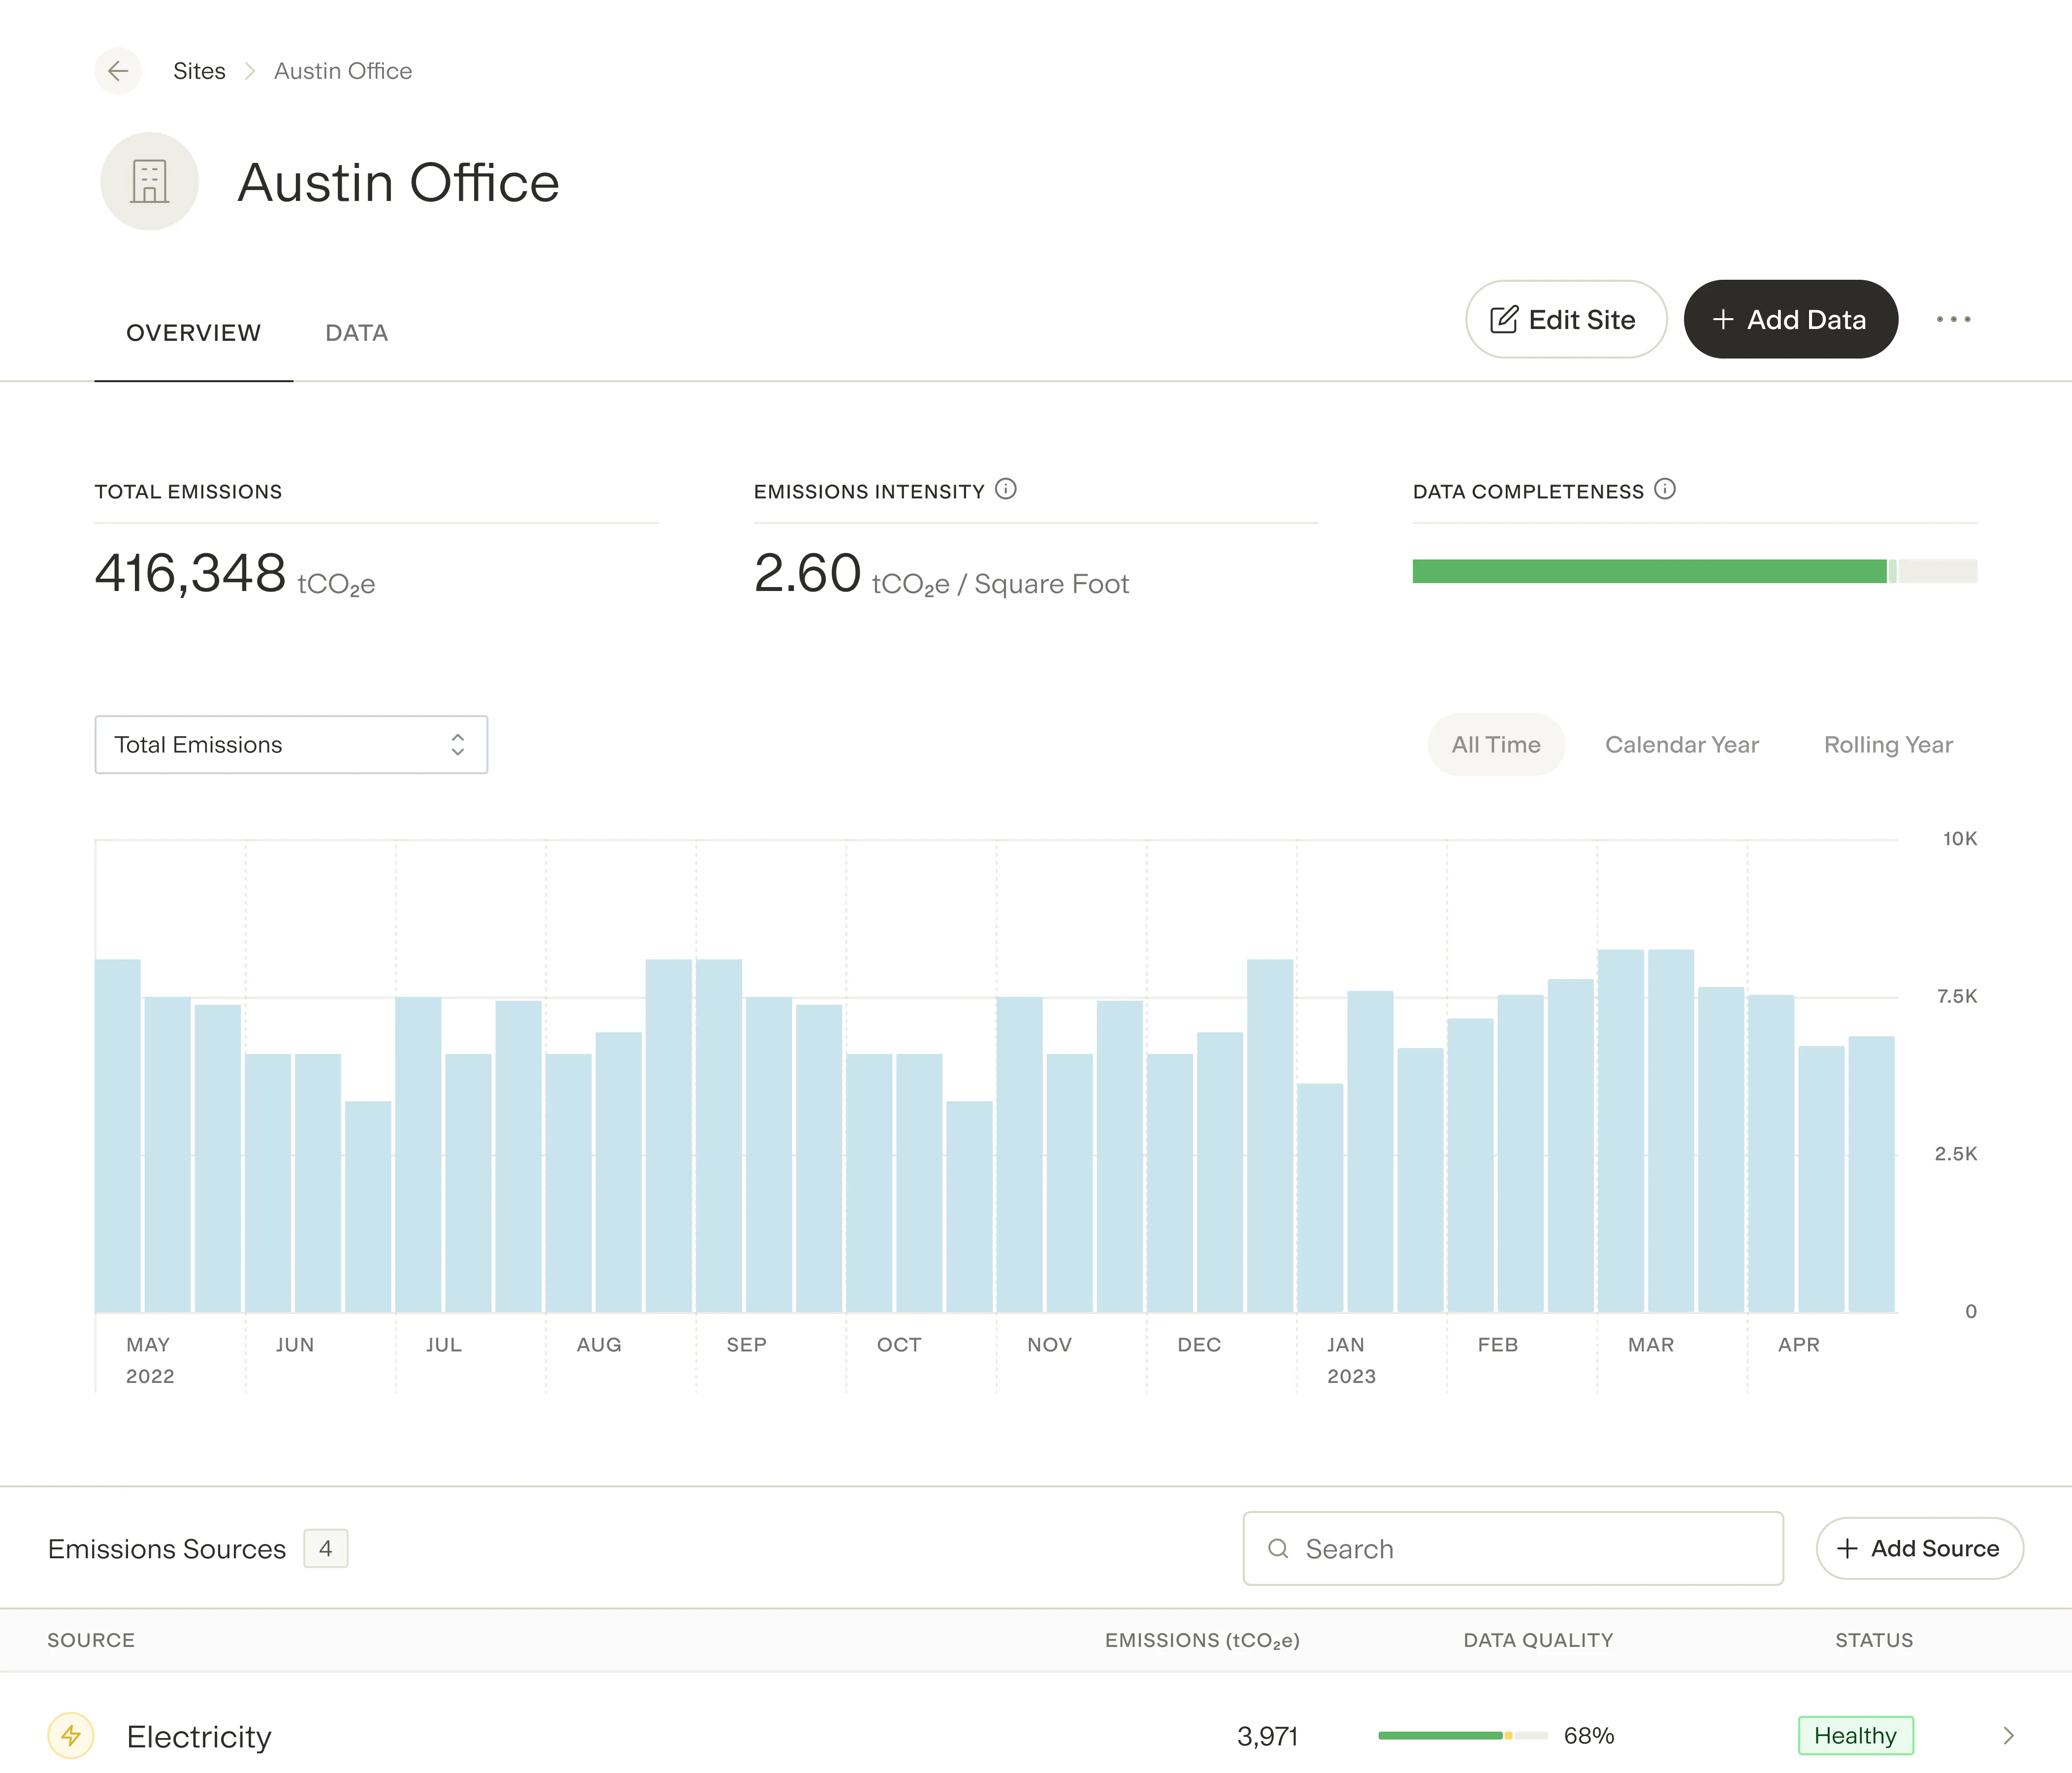
Energy Management
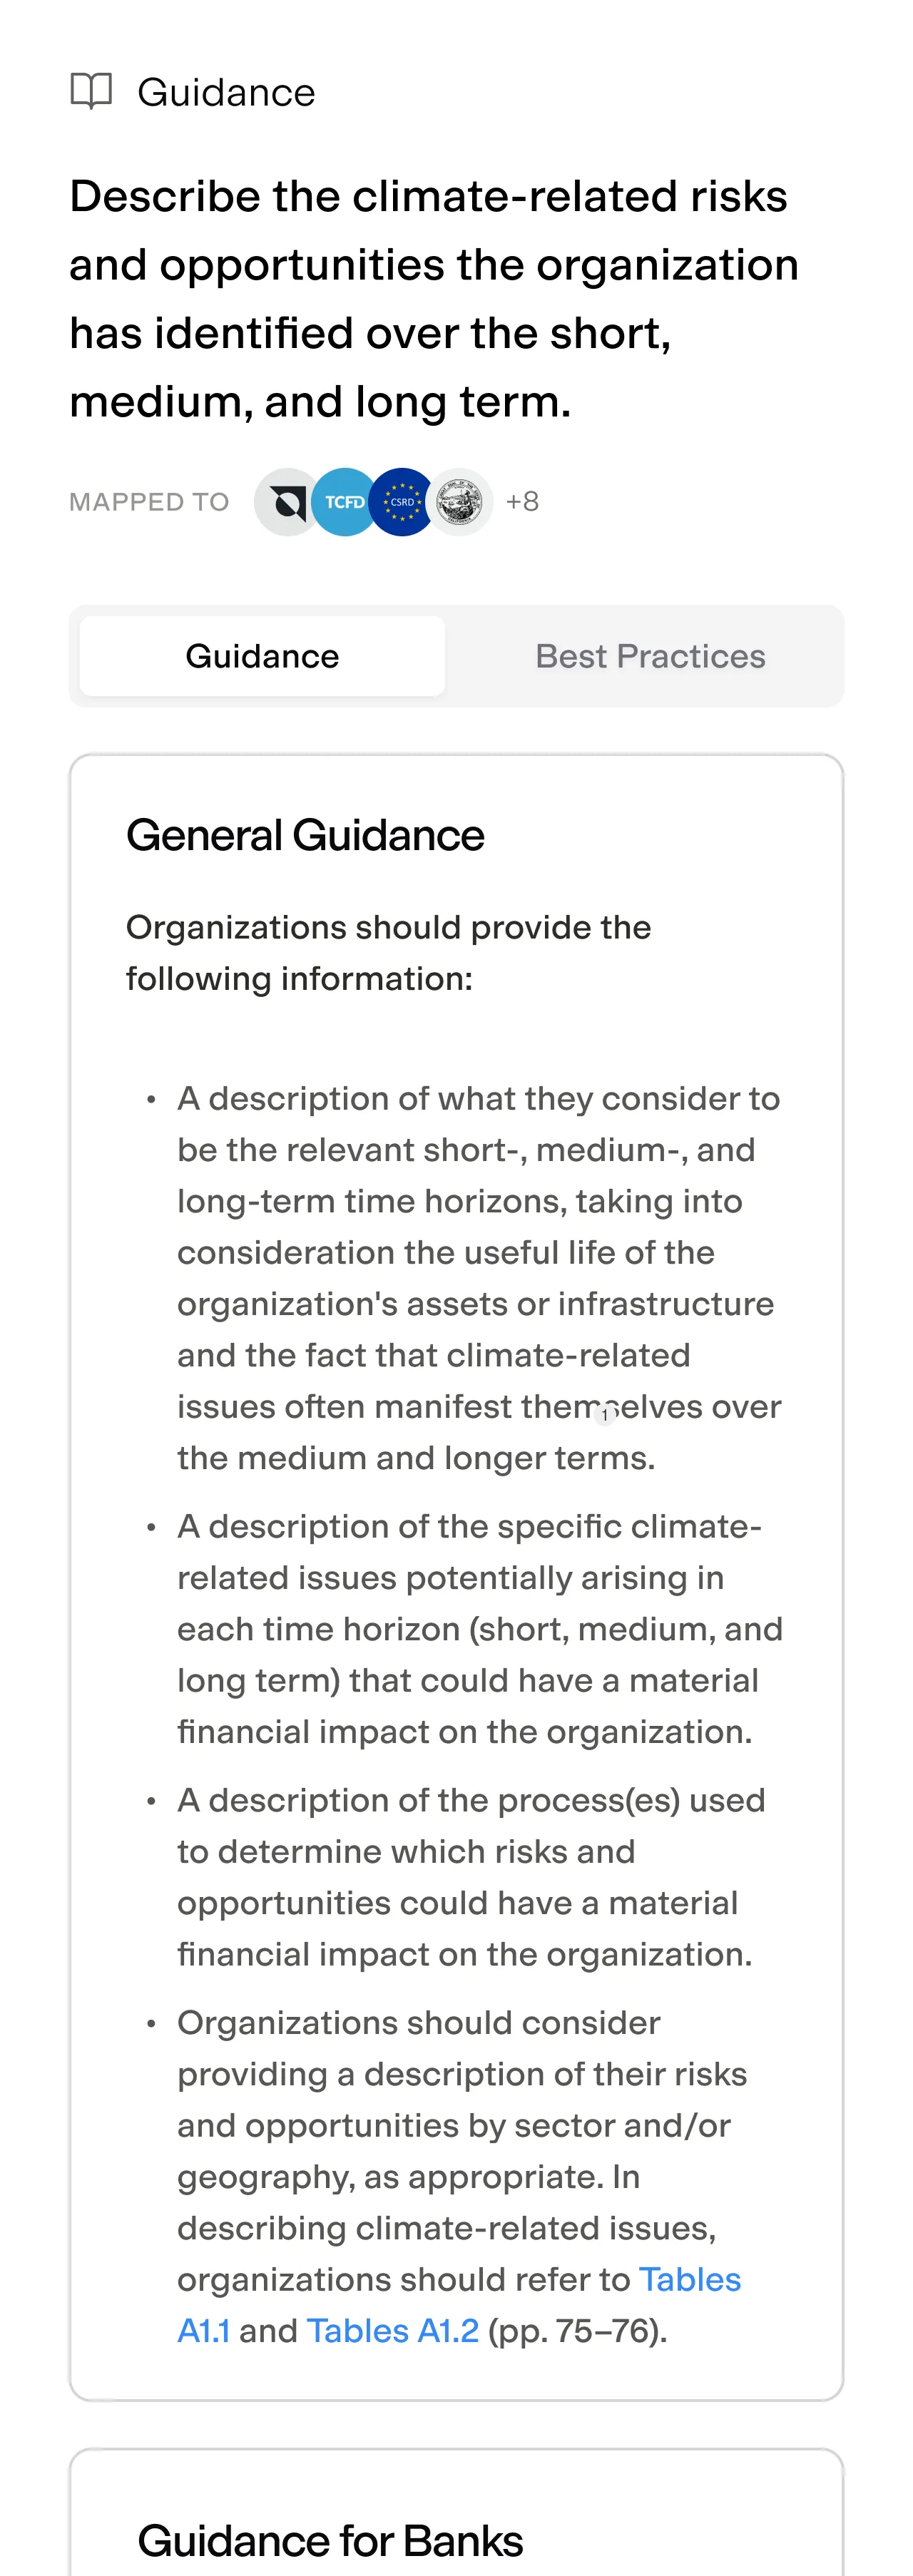
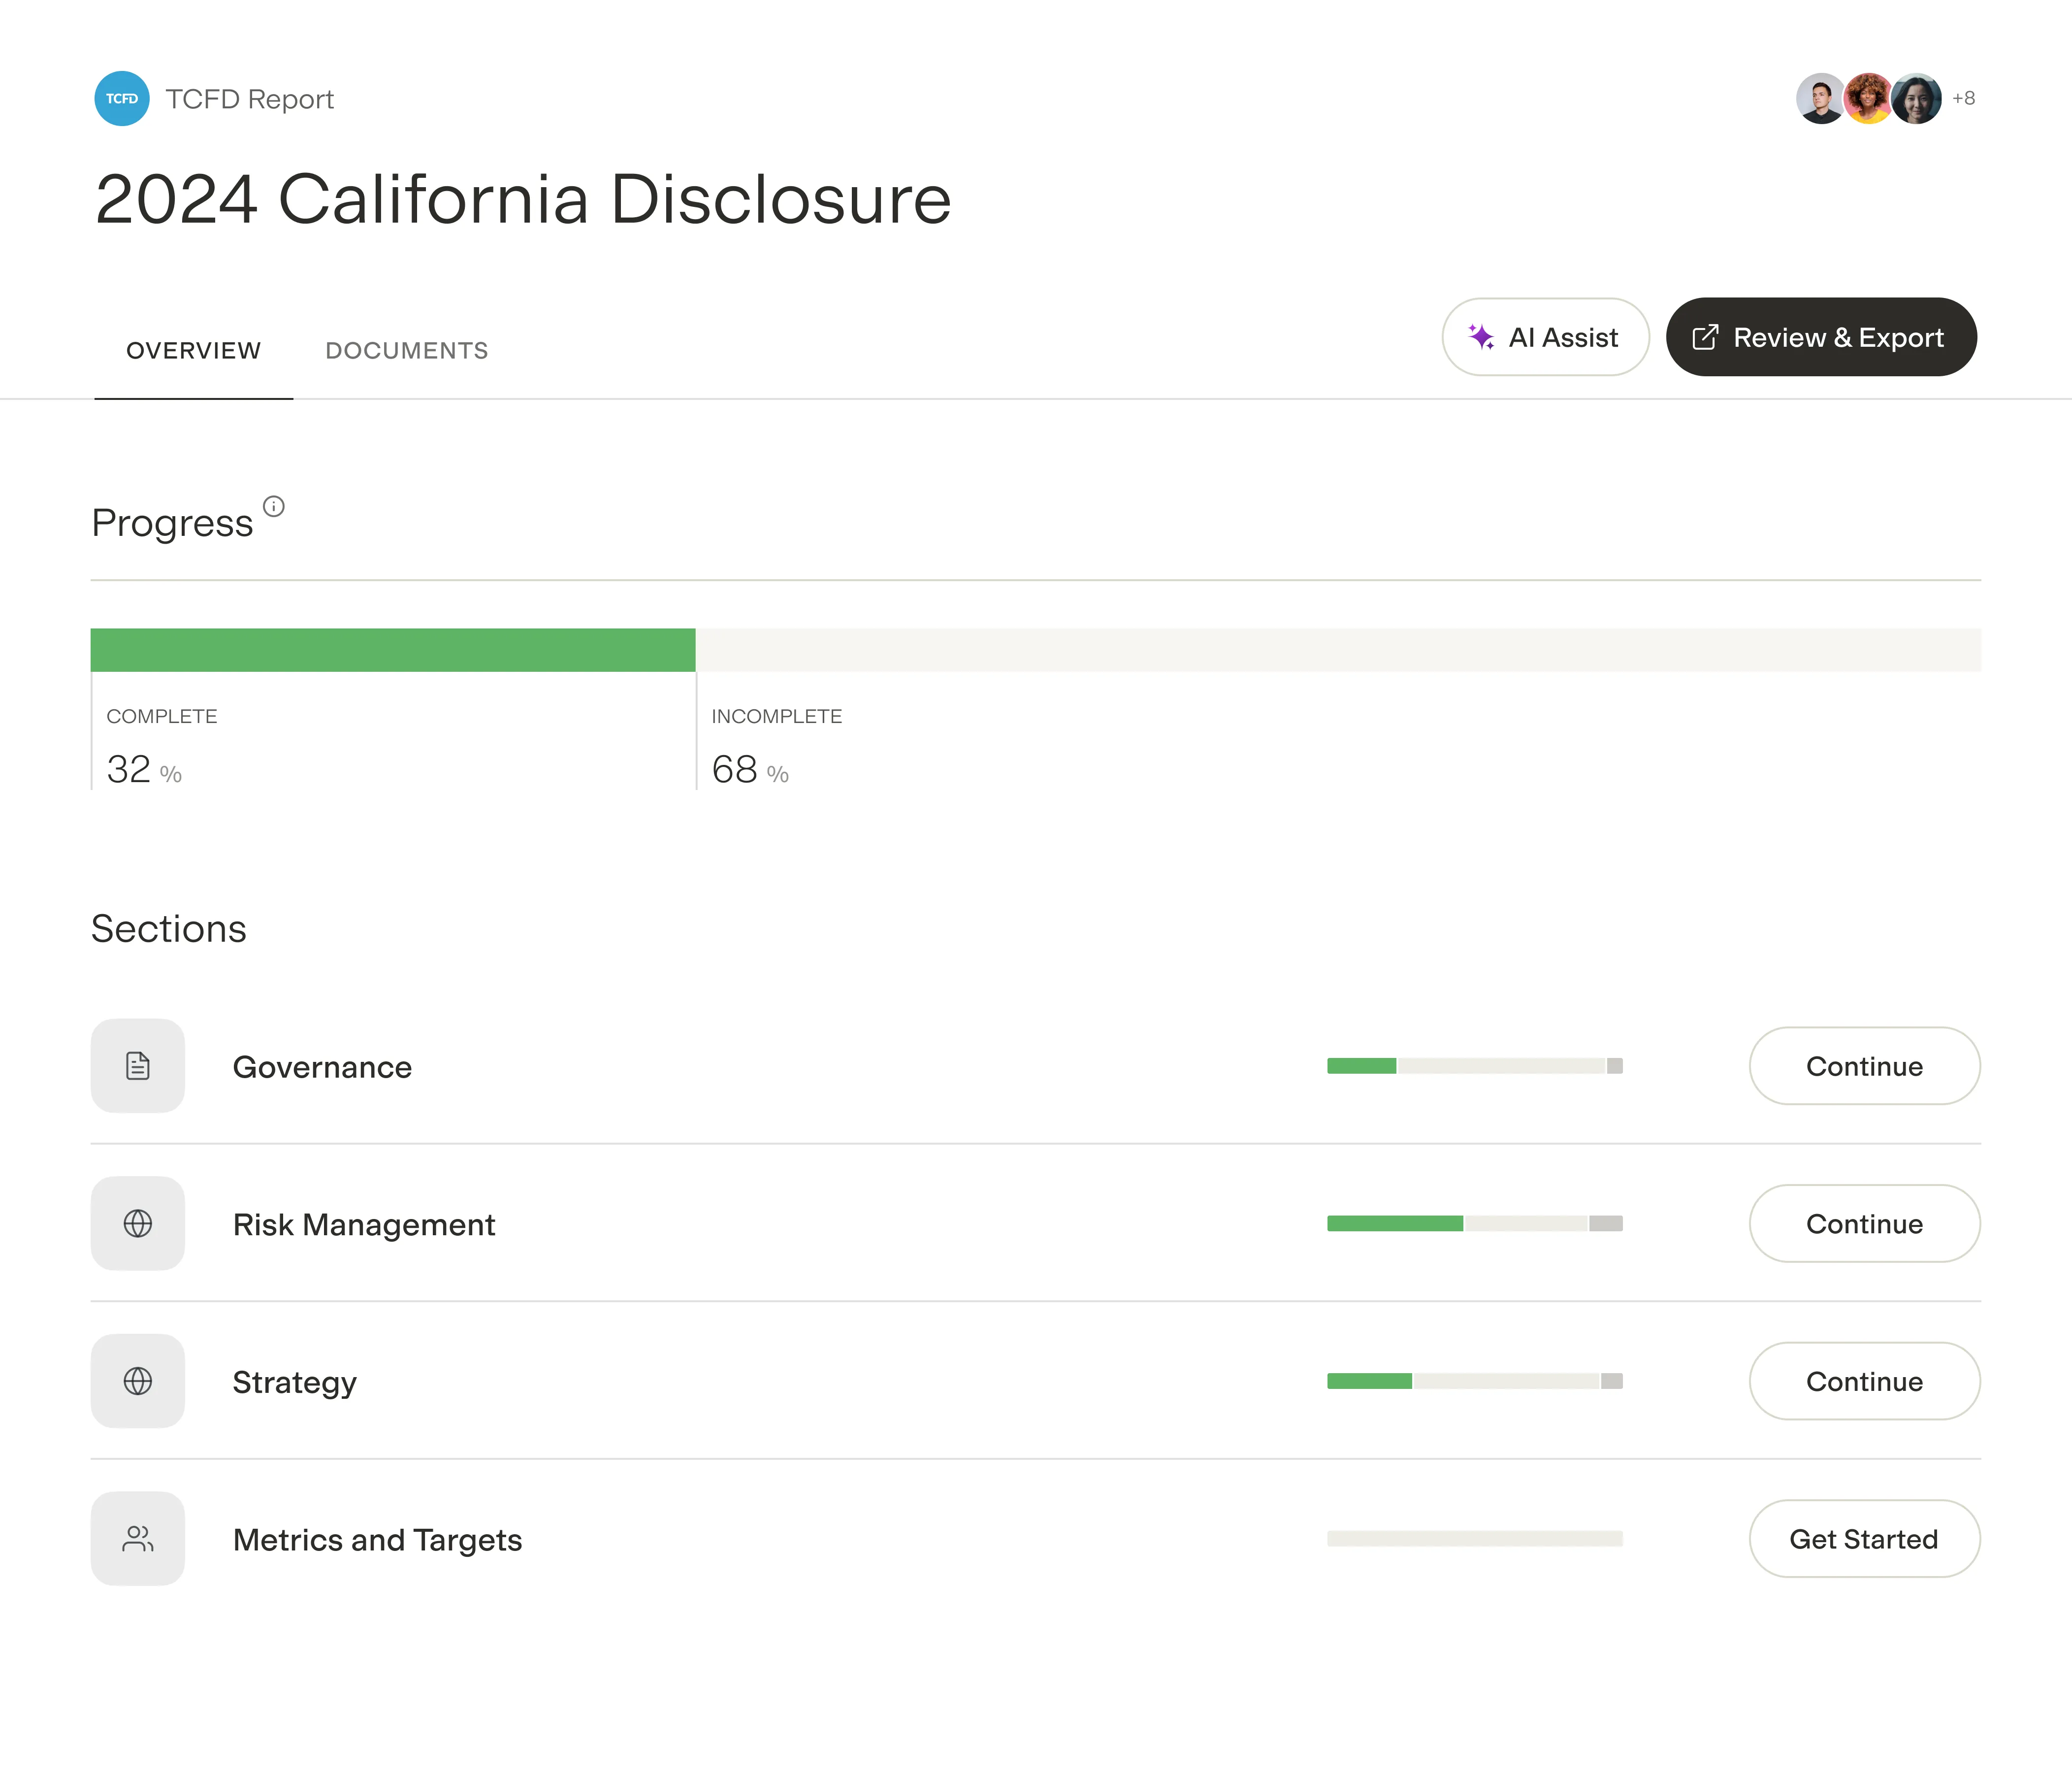
Sustainability Reporting
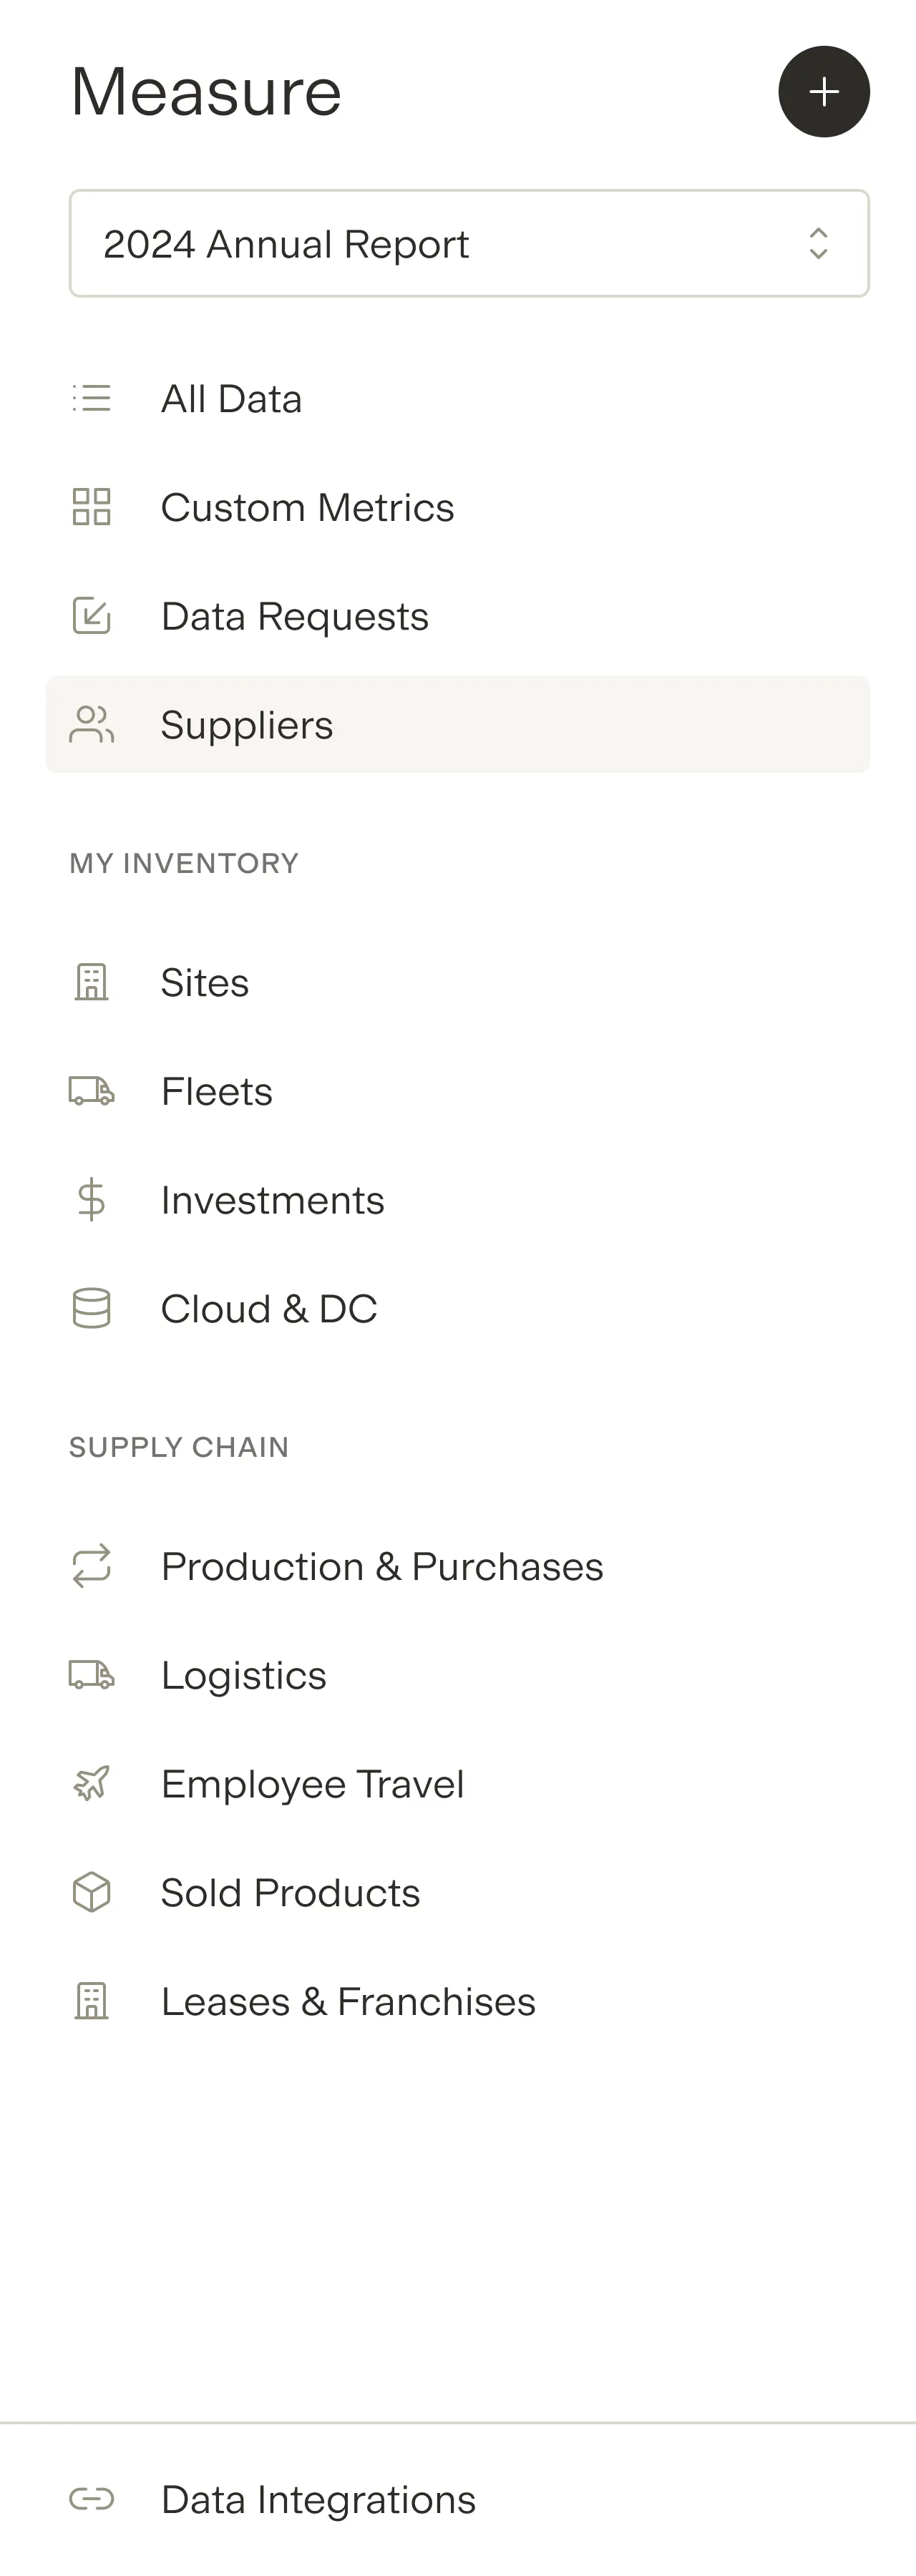
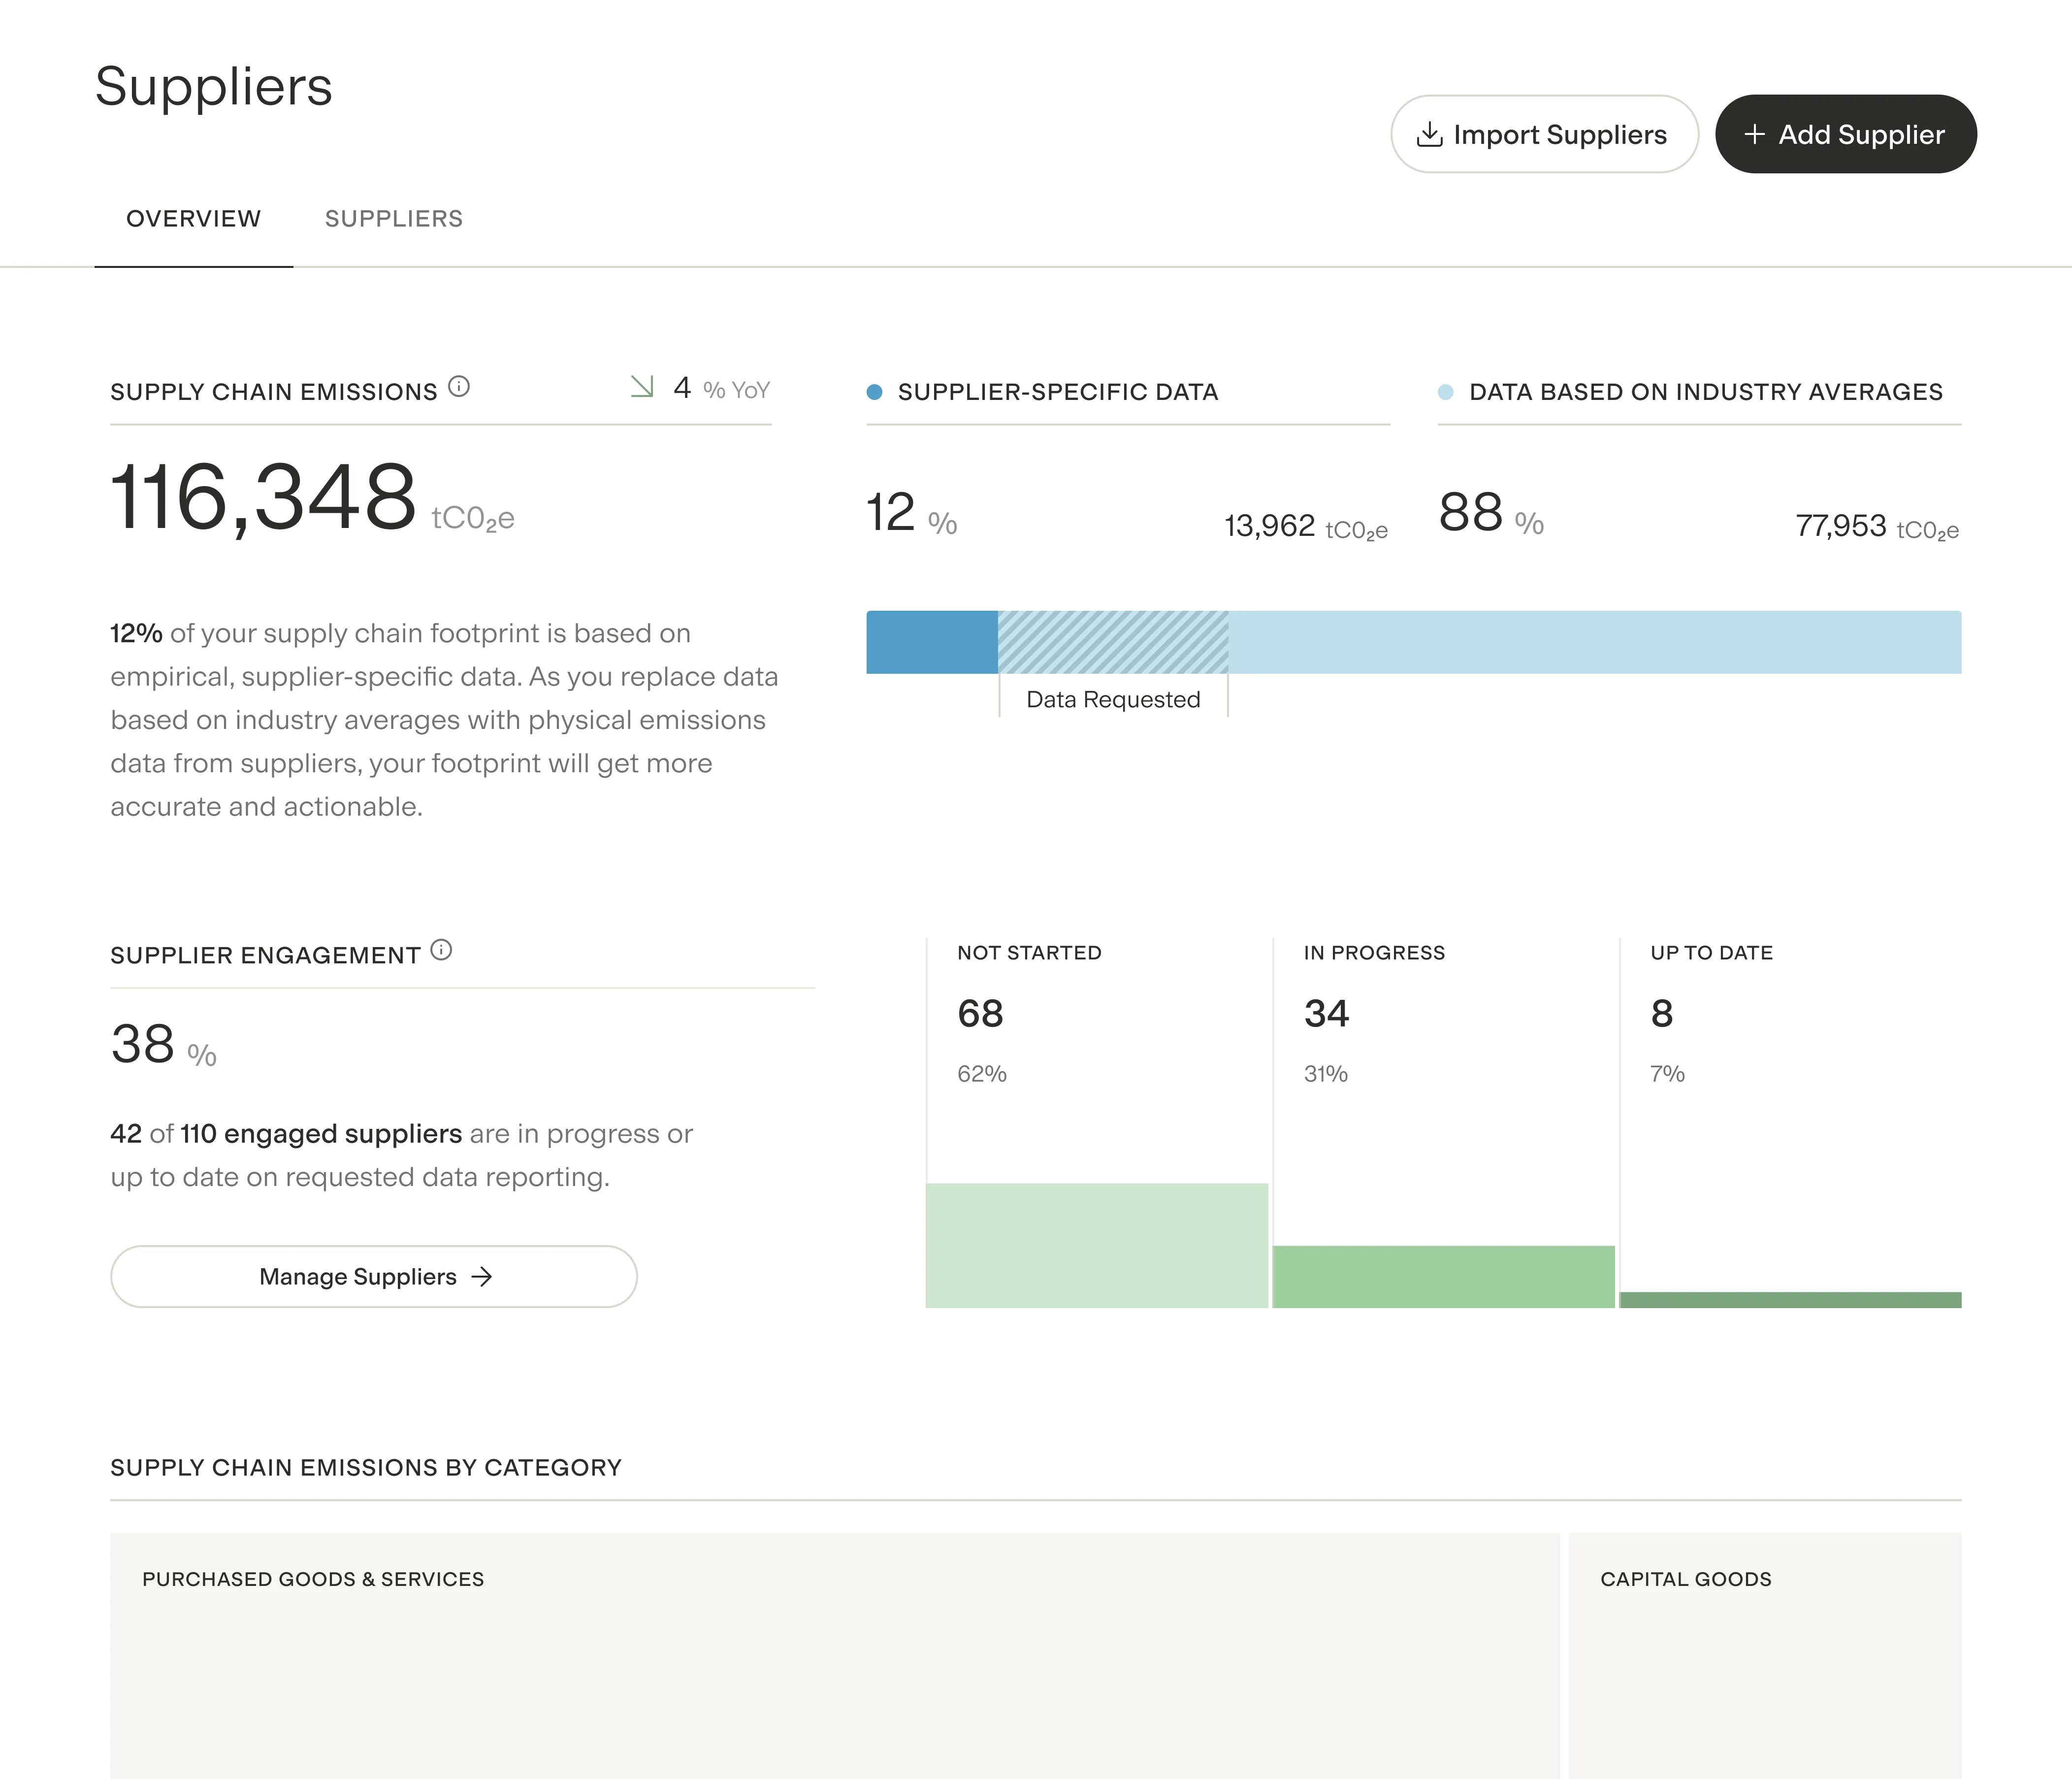
Scope 3 Measurement
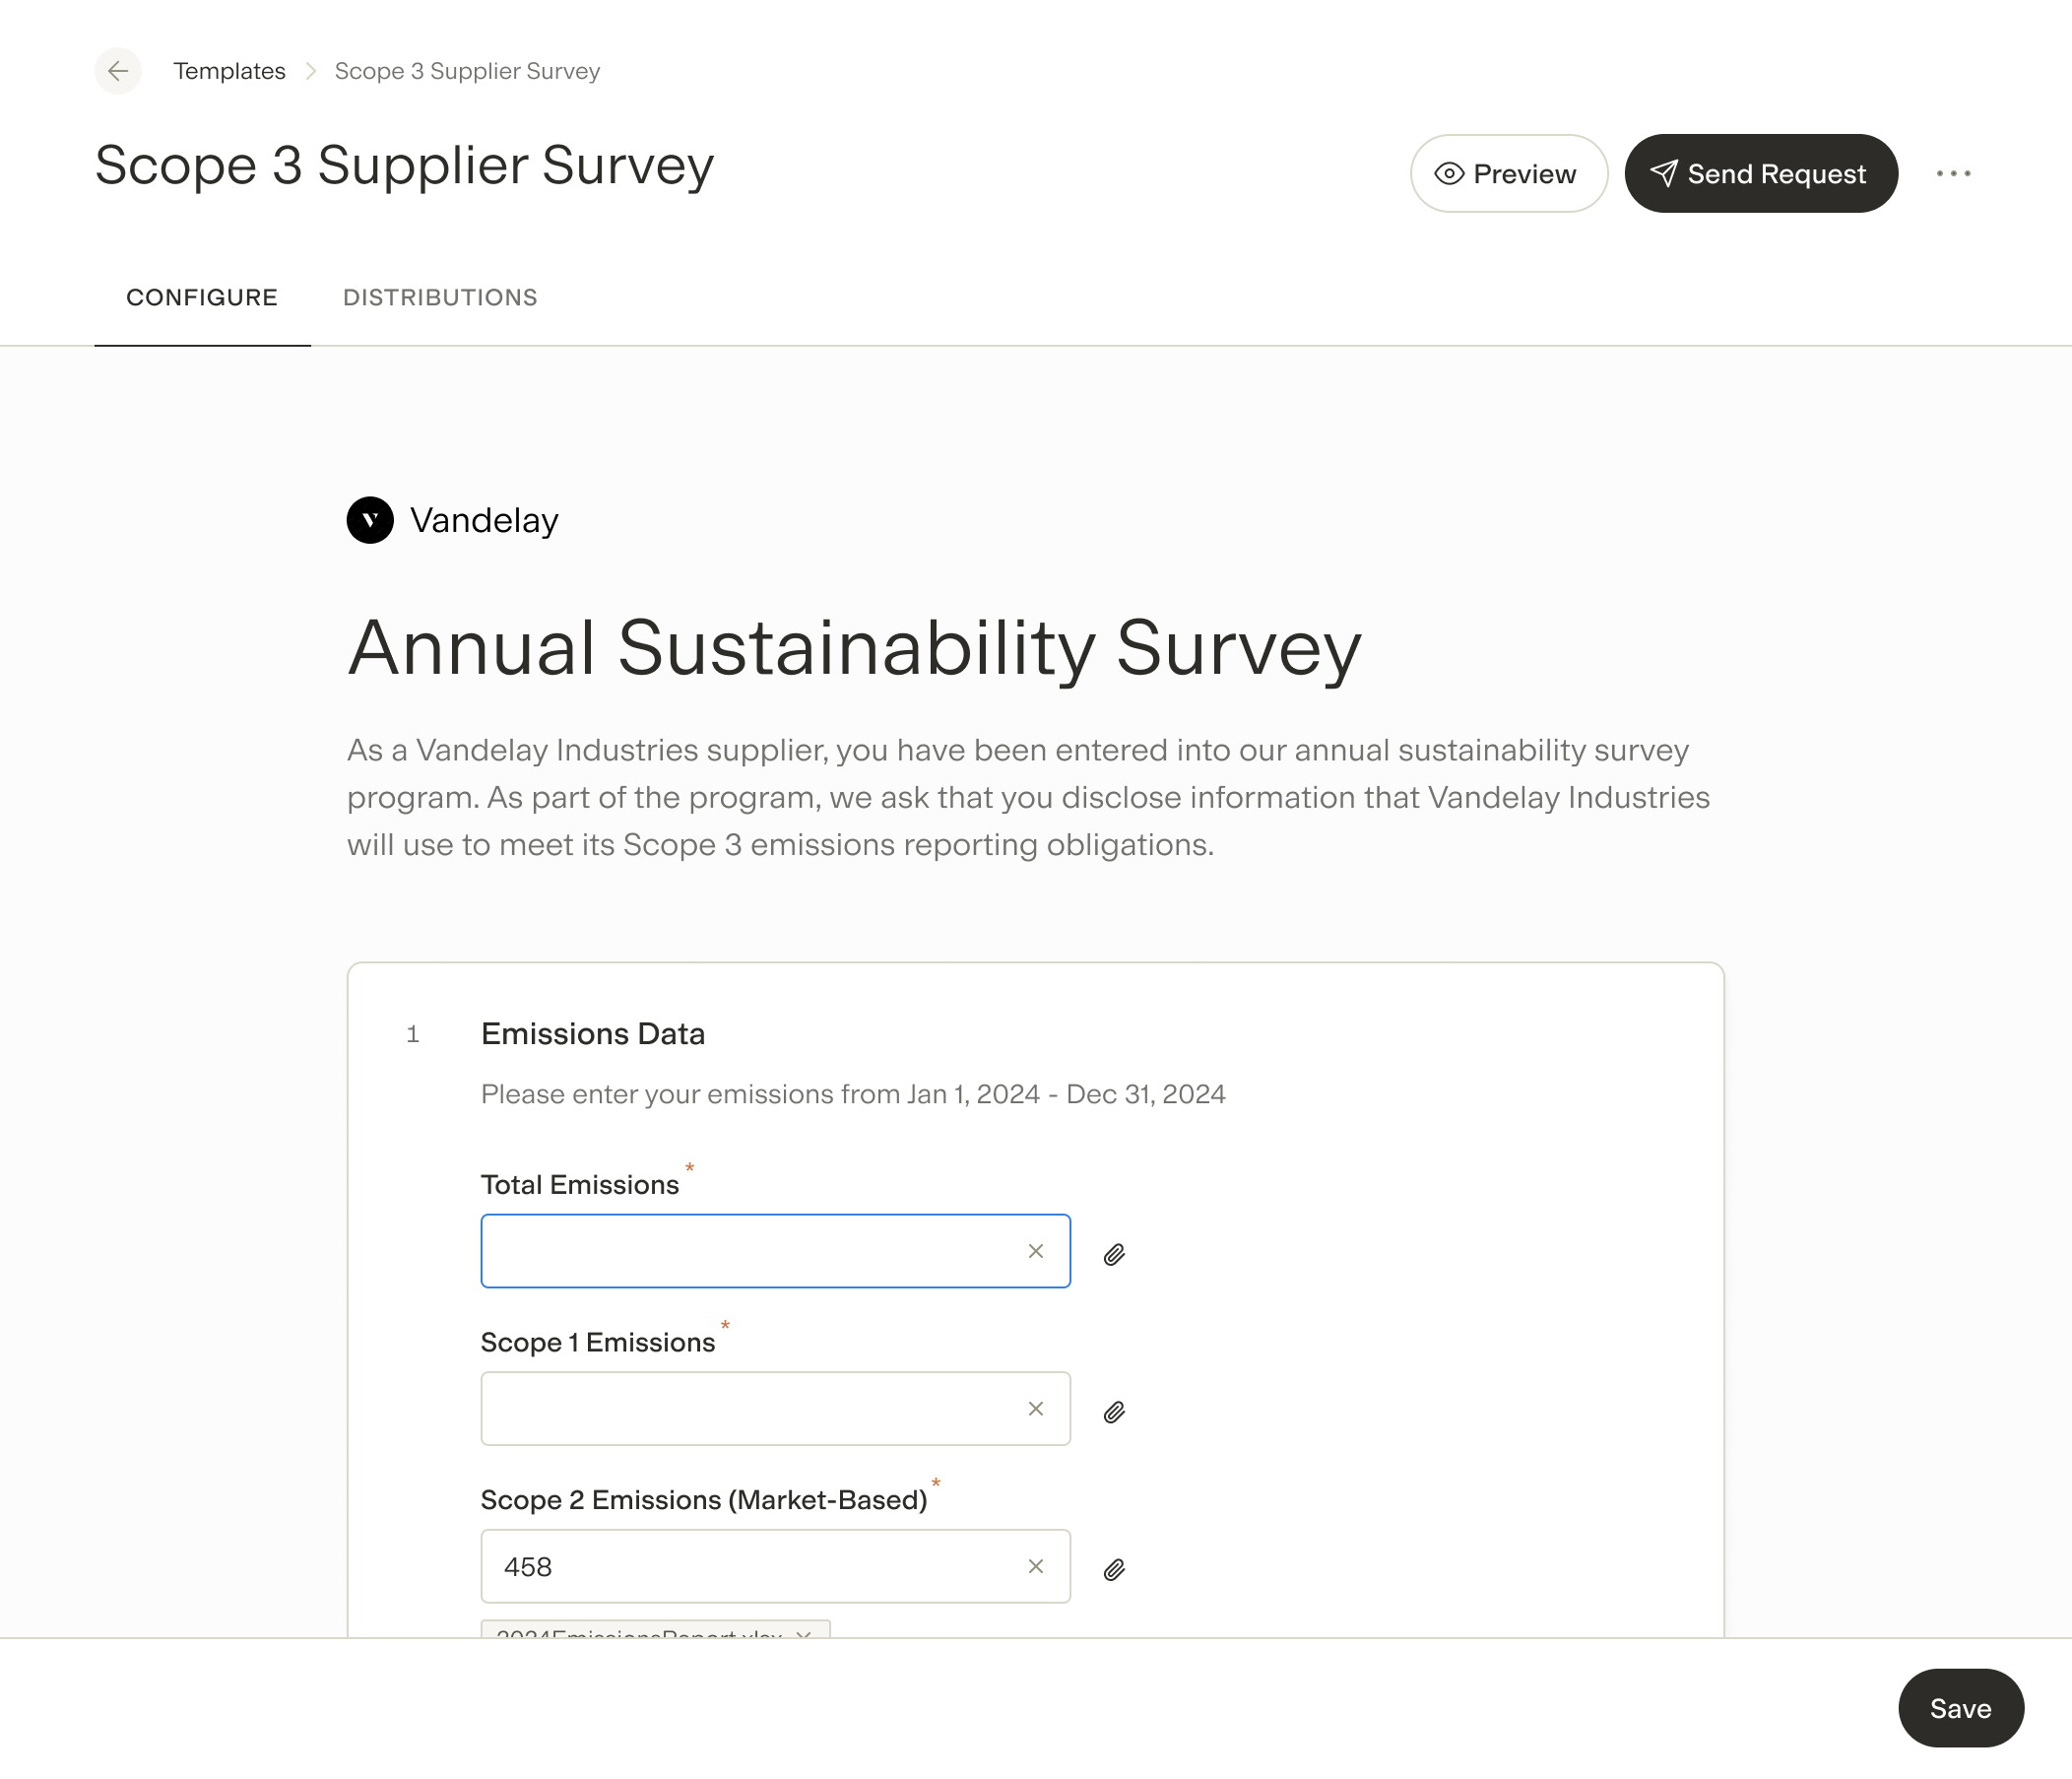
Supplier Engagement
Financed Emissions
Gravity is the only enterprise carbon and energy management platform.
Automate your reporting and deploy cost-saving energy projects.


%20(1).png)